


This series builds off each volume, so if you still need to read The Intelligent Fantasy Football Investor (IFFI) Volumes 1-11, please stop and read them on Dynasty Nerds [Link]. This series aims to bring investment concepts and a different thought process to the fantasy football community.
The premise is that we should value fantasy players based on the relationship between a player’s price and his earnings. Or his P/E ratio. Price is a player’s KeepTradeCut (KTC) number. KTC = price. Fantasy per-game (PPG) points are a player’s earnings. So, putting it all together: P/E = KTC / PPG (note: divided by 10 for simplicity). When comparing similar assets (like for like), the lower the P/E, the more value you get from that player. The best way to use P/E is to look at clusters w/in each position group for value.
IFFI
We just finished up NFL Week 15. You are likely well into your league’s fantasy playoffs, and things should be wrapping up in the next week or two. Most dynasty leagues are operating with a trade deadline which may prevent you from making moves in the near term. But now is the time to plan for next year and the future of your dynasty team. And for those of you playing in leagues with no trade deadlines, lucky you; hopefully, you can put some of what you read here to work today. In vol. 12, we will look at some charts I made to help visualize the valuation of players, and we are going to go through my current top picks to help you be as prepared as possible for when that new season rolls around, and trading opens back up.
Visualization
For IFFI, one of my goals is to look at things in different ways than everyone else. And to bring tools from the investments world to fantasy football. And that’s what I’m going to do with this visualization section.
So if you go to keeptradecut.com and click on a player, they will show you a chart of that player’s KTC price over time, which looks like this.
I collected the data from this chart and made it into this.
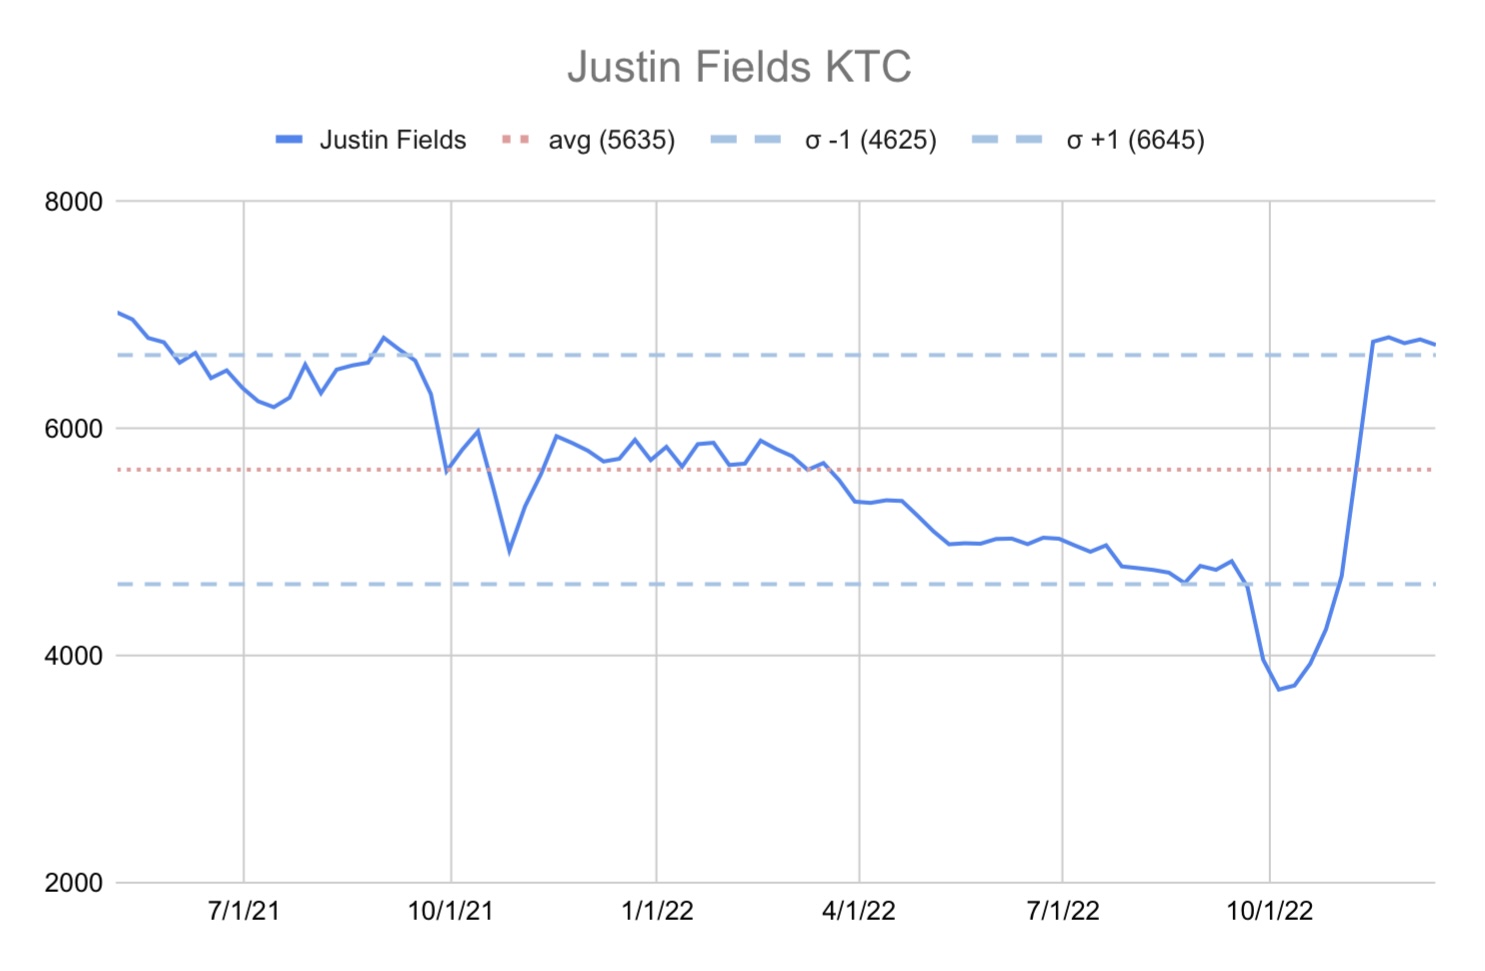
Hopefully, this chart is much more helpful than just your typical price chart over time. I added the player’s average KTC price and included +/- 1 standard deviation on either side. This chart might help you with some insight into buy/sell points for players. We are not doing anything crazy here, but the chart is a bit more descriptive of each player’s valuation situation; it provides context.
So how do we use this? What’s going on here?
First, looking at the Fields’ chart, direct your attention to the red line, which runs down the center at a KTC of ~5635. That line is the average KTC of Fields from the start of his NFL career to the present.
Next is the standard deviation part of the chart. Standard deviation is from statistics and measures the variation or dispersion of a set of values. And the point is that ~68% of all observations should be within plus or minus one standard deviation. So Fields’ plus one standard deviation measurement is ~6645 KTC, and his minus one standard deviation measurement is ~4625 KTC. Or in other words, 68% of Fields’ KTC observations should fall between 4625 and 6645 KTC.
If Fields’ KTC price ever ventures above or below those dashed lines, you would expect his price to move back closer to the average red line over time. If his price is above the upper bound, maybe Fields looks expensive to his past. And if his price drifts below the lower bound, perhaps he looks cheap relative to his past.
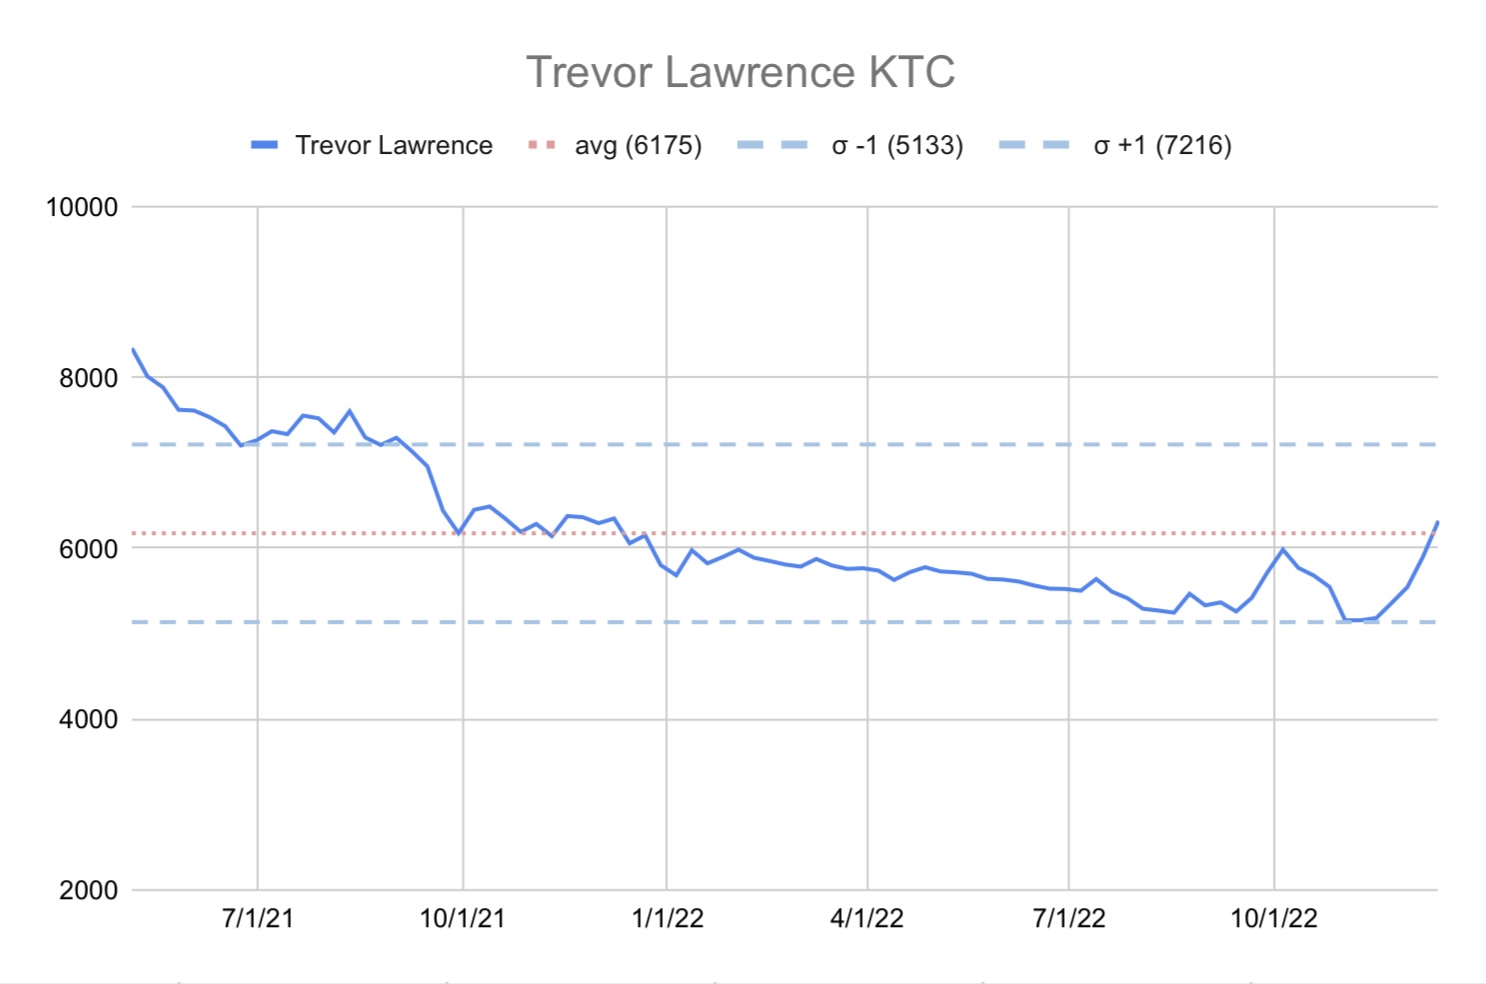
Let me share a couple more charts to give some more perspective. Here is Trevor Lawrence.
And here is Trey Lance.
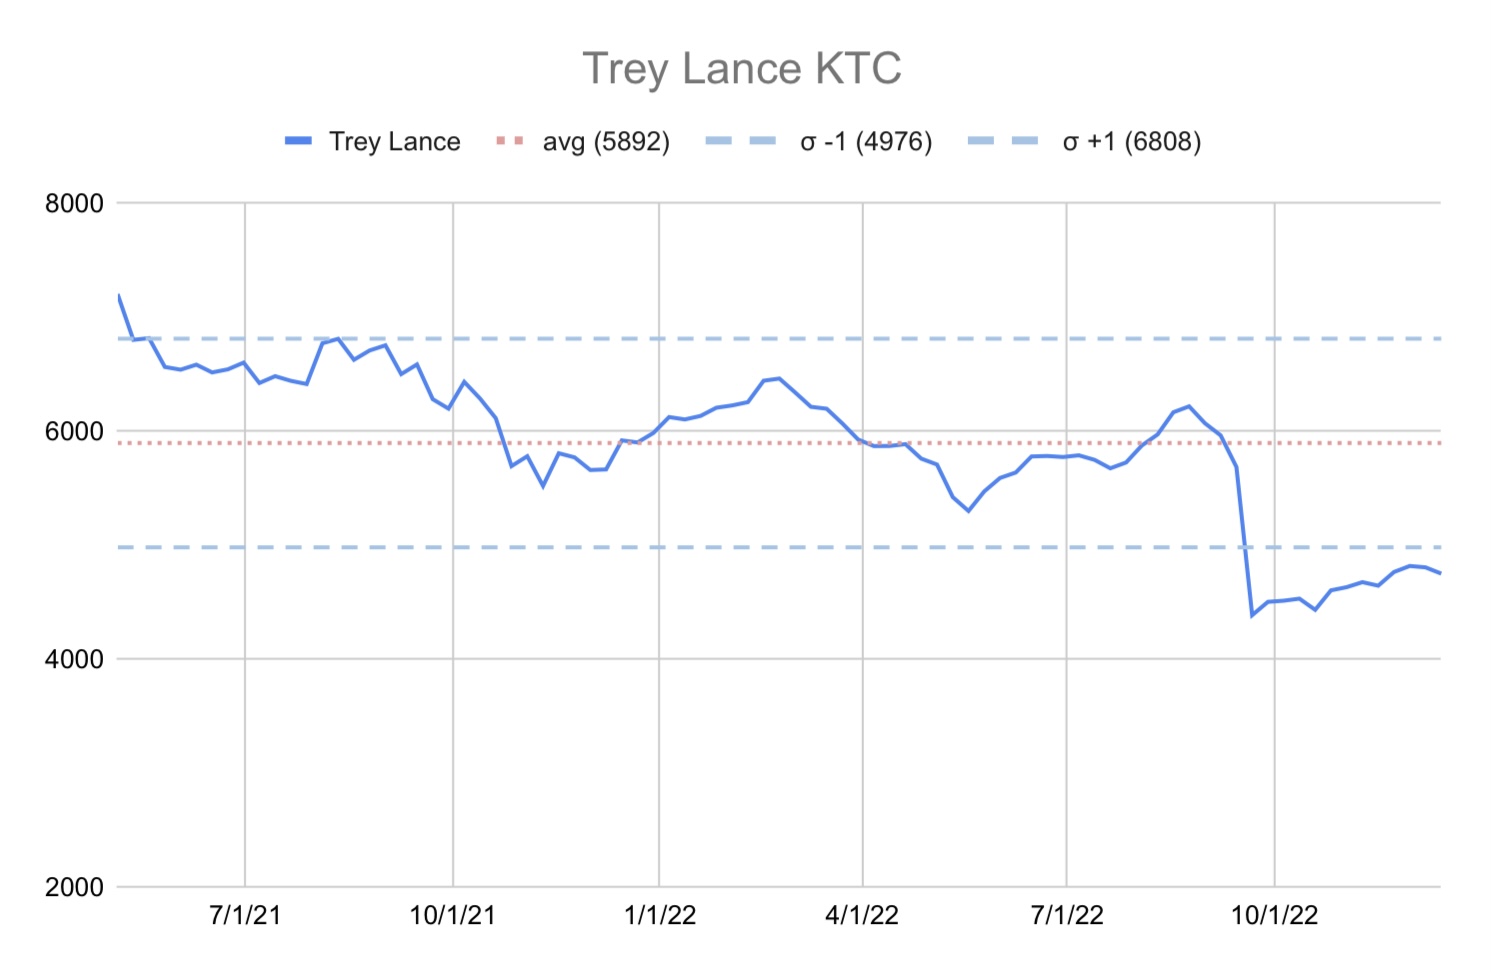
So if you compare the individual Fields, Lawrence, and Lance charts, you might say Fields looks expensive vs. his past, Lawrence looks fairly valued vs. his past, and Lance looks cheap vs. his past but risky. So right now, the charts are saying Fields may be closer to a selling point, Lawrence is near his average, and you should hold him, and Lance looks cheap, so you should buy him, and his price should drift back to his average price line.
Limitations
This type of analysis works best with many data points. Therefore, it will not be as helpful with rookies with few data points, where we are still in price discovery mode. Also, it will not be beneficial for older veterans on the path to lower valuations as they become less and less relevant. So you have to use some discretion and not just use a chart like this blindly.
More visualization
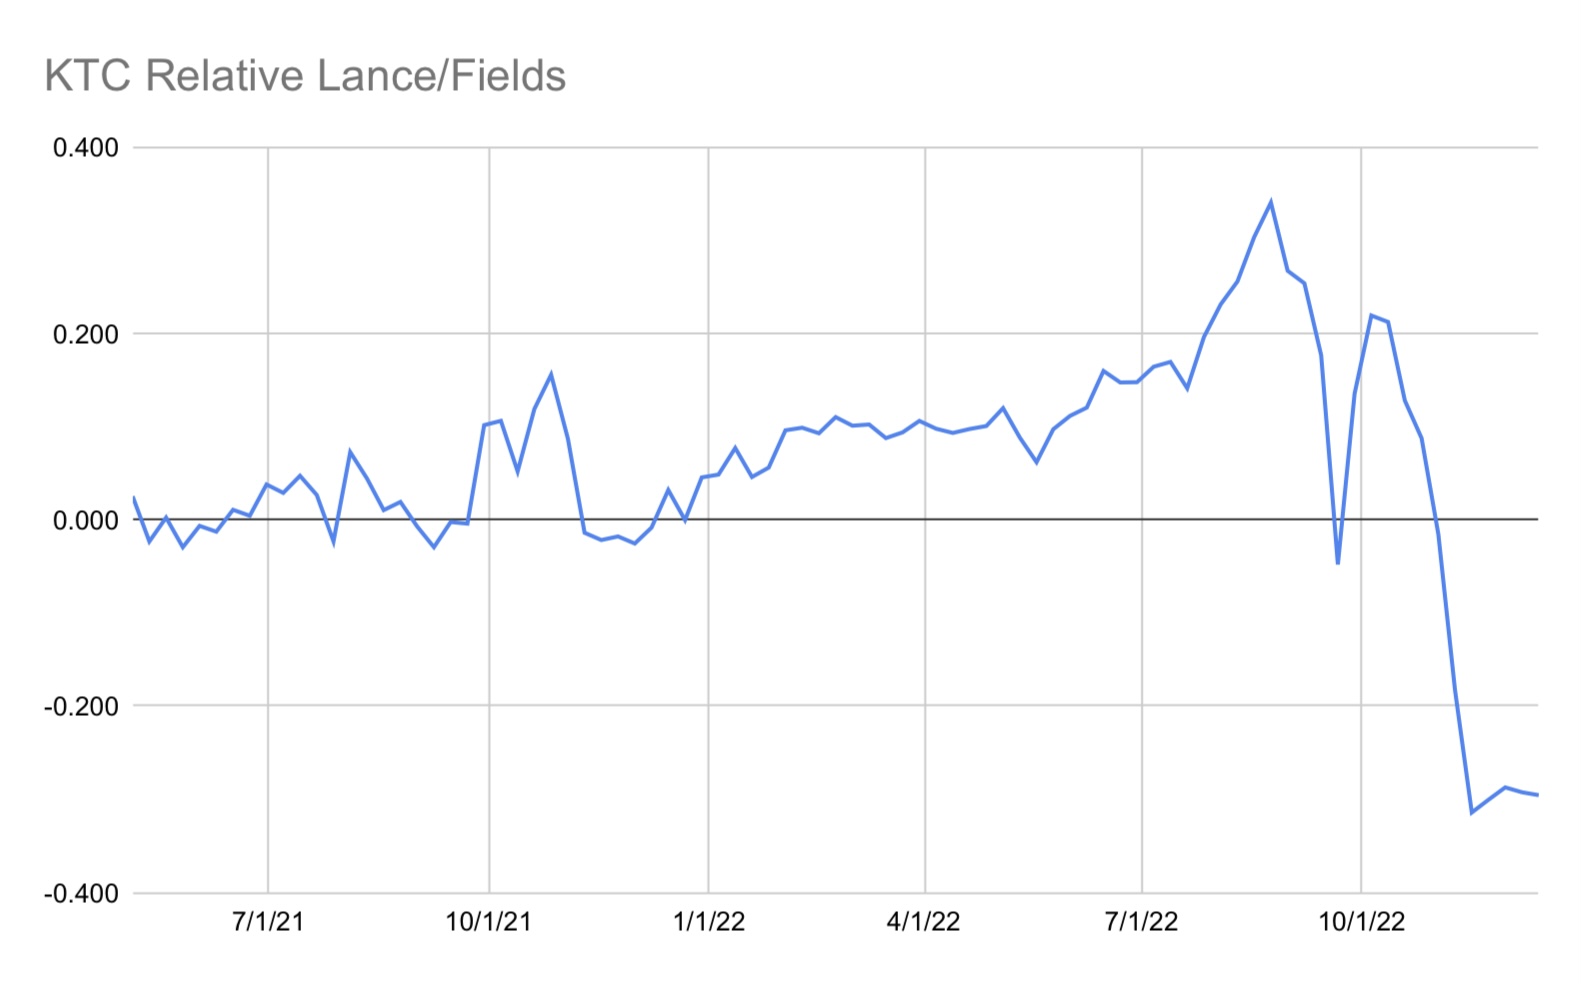
Here are a few more charts for you to examine. This one has Lawerence, Lance, & Fields’ KTC prices on one chart. The chart gives you an idea of how these guys have performed relative to each other.

And here is one on the spread in Lance’s KTC minus Fields KTC over time. The spread is just the difference in their absolute KTCs. So if you look at the start of the chart, you can see Lance and Fields’ KTCs were somewhat similar as they entered the league, then the line moves up and down, and by the end, it shows that Fields’ KTC is about 2000 KTC more than Lance. We are not saying anything groundbreaking here, just visually looking at two players relative to each other and how that has trended over time.

And this last chart is on relative value, which is calculated as ((Lance KTC / Fields KTC ) – 1), so when you are above 0, that means Lance is outperforming Fields, and when you are below 0, that means Fields is outperforming Lance. And the point of the relative chart would be to compare a player to his market (like the total market, his position group, or the top of his position group), not necessarily just another player. So like Tesla vs. the S&P 500 or one semiconductor company vs. all semiconductor companies.
IFFI Update
Thanks for listening to me on those visualizations, I’m not sure how those will play out over time, but I thought they might provoke a new way to think about things. Now we will move on to the meat of the IFFI process, get to some valuation updates using P/Es, and give you some new top picks.
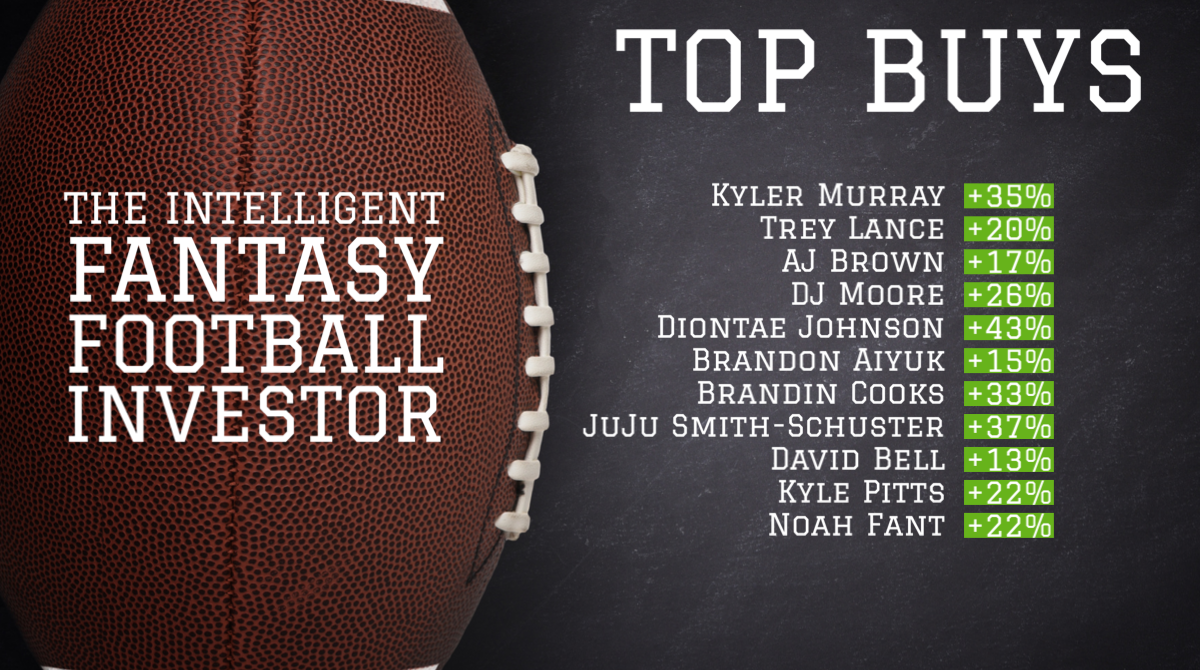
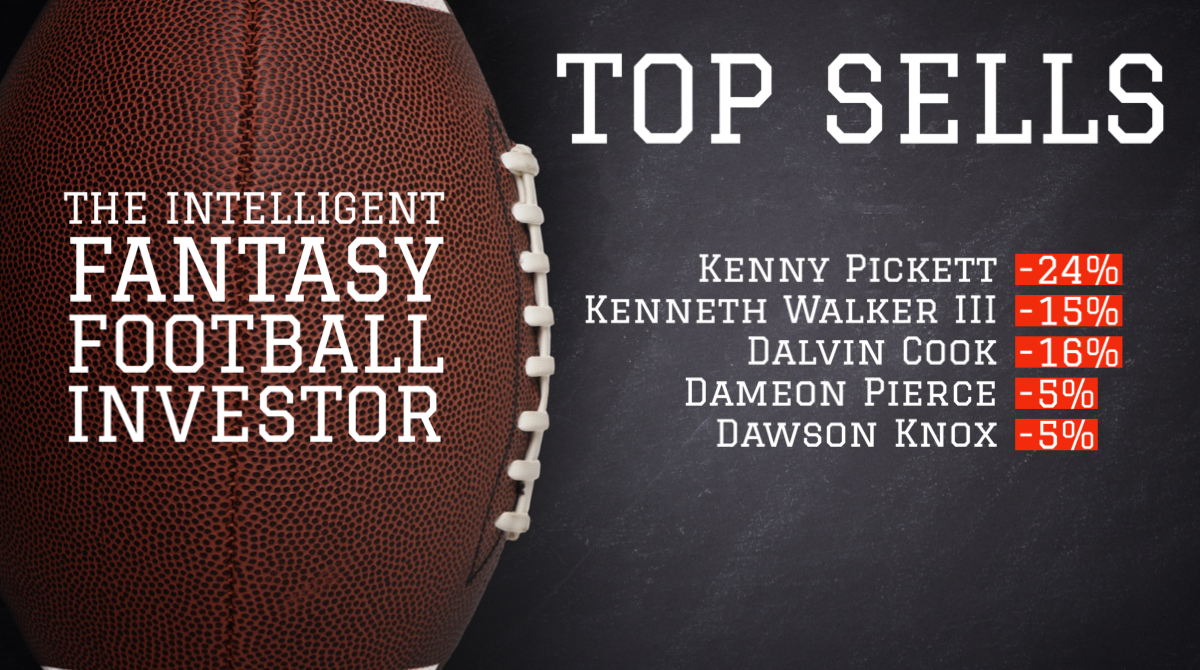
Twitter/Discord IFFI Upgrades/Downgrades
I’ve made a few upgrades/downgrades on Twitter/Nerds Discord since Vol. 11 was published, and I’d like to share a brief update on those changes. Downgrades from Buy to Hold: Amon-Ra St. Brown (+17% favorable). Upgrades from Sell to Hold: Khalil Herbert (-13% favorable) and Gabriel Davis (-19% favorable). Also, I closed my Buy Fields / Short Lance Pair trade from 3/16/22. The trade added ~2400 KTC. As you can see, all favorable recommendations. See my track record below for a complete picture of these trades.
Summary of today’s rating changes:
Upgrade to Buy: Trey Lance & Kyle Pitts
Downgrade to Hold: Tom Brady, James Conner, Hunter Henry, & Brevin Jordan
Upgrade to Hold: Nick Chubb & Pat Freiermuth
Downgrade to Sell: Dalvin Cook
Downgrade from Buy to Hold / Time to take some losses
Taking losses is always challenging; sometimes, you just get it wrong. My advice is if you miss, cut your losses and move on as quickly as you can. There is no reason to continue recommending something even though your process says it’s not right, just because you don’t want to be wrong. Cut the cord and use those resources to go after better investment ideas.
We are going to downgrade these guys from Buy to Hold: Tom Brady (-1151 KTC), James Conner (-546 KTC), Hunter Henry (-550 KTC), & Brevin Jordan (-414 KTC). These guys have been on my top Buys list for a long time, but it’s time to move on. For various reasons, they didn’t work, and it’s time to focus on better ideas.
Upgrade from Sell to Hold
I’m going to take a couple of losses here as well. They didn’t necessarily cost me much in terms of KTC, but both were the wrong call at the time. I’m upgrading Nick Chubb from Sell to Hold. I first recommended selling Chubb in July, and his KTC was 4806; I put a price target on him of ~3850. Then in the last IFFI, I revised his price target to ~4800, an acknowledgment that I somewhat got this one wrong. Lo and behold, Chubb’s price has drifted down to within 3% of that original 4800 price, so I’m going to cut my loss and lock in a 2% unfavorable performance or a loss of ~115 KTC.
Also, I got called out on my Pat Freiermuth (Muth) sell recommendation by Peter Howard, and he made some valid points about how to think about Muth long-term. So I’m going to bite the bullet and upgrade him here today. Again it won’t cost me much to move on from this recommendation KTC-wise, except maybe a little bruise to the ego. The result was a 1% unfavorable move or a loss of 45 KTC.
Upgrade to Buy
Trey Lance: Target Price (TP) = 5850 (+20% upside)
Kyle Pitts: TP = 6400 (+22%)
Trey Lance
The IFFI process is about looking at valuations relative to your direct peers that are of a similar age and similar potential. My peer group for Lance is Justin Fields and Trevor Lawrence. The visualization charts I made above were partly to provide more context for this Lance upgrade to buy.
Please take a look at the KTC chart where I have the three players graphed on the same chart; you can see that each one of the guys, at one point or another, has worn the highest KTC price crown. Lance was on top this offseason when everyone was excited to see him run the 49ers’ offense and, in particular, excited to see what he could do on the ground. Then he was injured and lost 2000 KTC. All the while, Fields and Lawrence have gone on to have impressive back halves of the season and have cemented themselves as some of the best young quarterbacks in the league.
Well, I may be wrong, and it is a bit risky, but I think Trey Lance has that potential, especially in a Kyle Shanahan offense. I see a 20% upside from current levels, and I’m putting a target price of ~5850 on him. If you use the Lance chart with the average price and the +/- 1 standard deviation, I have Lance moving from minus one standard deviation back to his average price. There’s nothing heroic about that; I’m just making a call that he’ll be the starter next year, and his price will get back to his historical average.
Kyle Pitts
I’ve talked about Kyle Pitts a few times in these IFFI volumes, so you might know a little about my affinity for the guy. But right now, Pitts is trading cheaper on a KTC basis than he has since he entered the league. If you believe in the profile and that, at some point, his situation improves, then he seems like an excellent buy at the moment. If you liked him but never had a chance to get in or refused to because of his valuation, guess what? Now is the time. I see a 22% upside from current levels, and I’m putting a 6400 KTC price target on him.
Downgrade to Sell
Dalvin Cook: Target Price (TP) = 3550 (-16% downside)
Dalvin Cook
This downgrade is more of a valuation call. Considering Cook’s P/E relative to his peers, he doesn’t score enough points to justify his price relative to guys like Nick Chubb, Derrick Henry, etc. It’s also a call on his outlook for next year. Cook will be 28 years old to start next season, and well, I guess you have ‘it’ until you don’t, but I can see a plausible scenario where Cook’s production drops off next year. So if he’s on my squad, I’m looking to move on. I see a 16% downside, and I’m putting a 3550 KTC target price on him.
Summary of IFFI recommendations:
Upside/Downside IFFI Players
Here are some players with valuation upside but weren’t added to the Top Buys list for whatever reason: Russell Wilson, Christian McCaffery, Elijah Mitchell, Cordarrelle Patterson, Cooper Kupp, Michael Pittman Jr, Marquise Brown, Romeo Doubs, Elijah Moore, Curtis Samuel, Mark Andrews, & David Njoku.
Here are some players with valuation downside but weren’t added to the Top Sells list for whatever reason: Tua Tagovailoa, Michael Carter, James Cook, Alec Pierce, Michael Gallup, & Dalton Schultz.
Example trades
Trey Lance (buy) = Kenny Pickett (sell) + 2023 mid 3rd
Kyle Pitts (buy) = Dameon Pierce (sell) + 2023 late 2nd
Dalvin Cook (sell) = DJ Moore (buy)
IFFI Track Record
We have had some wins since the last update with the Herbert, St. Brown, Davis, and Fields/Lance trades. But we also took some big Ls and moved on from some positions in Brady, Conner, Henry, Jordan, Chubb, & Freiermuth.
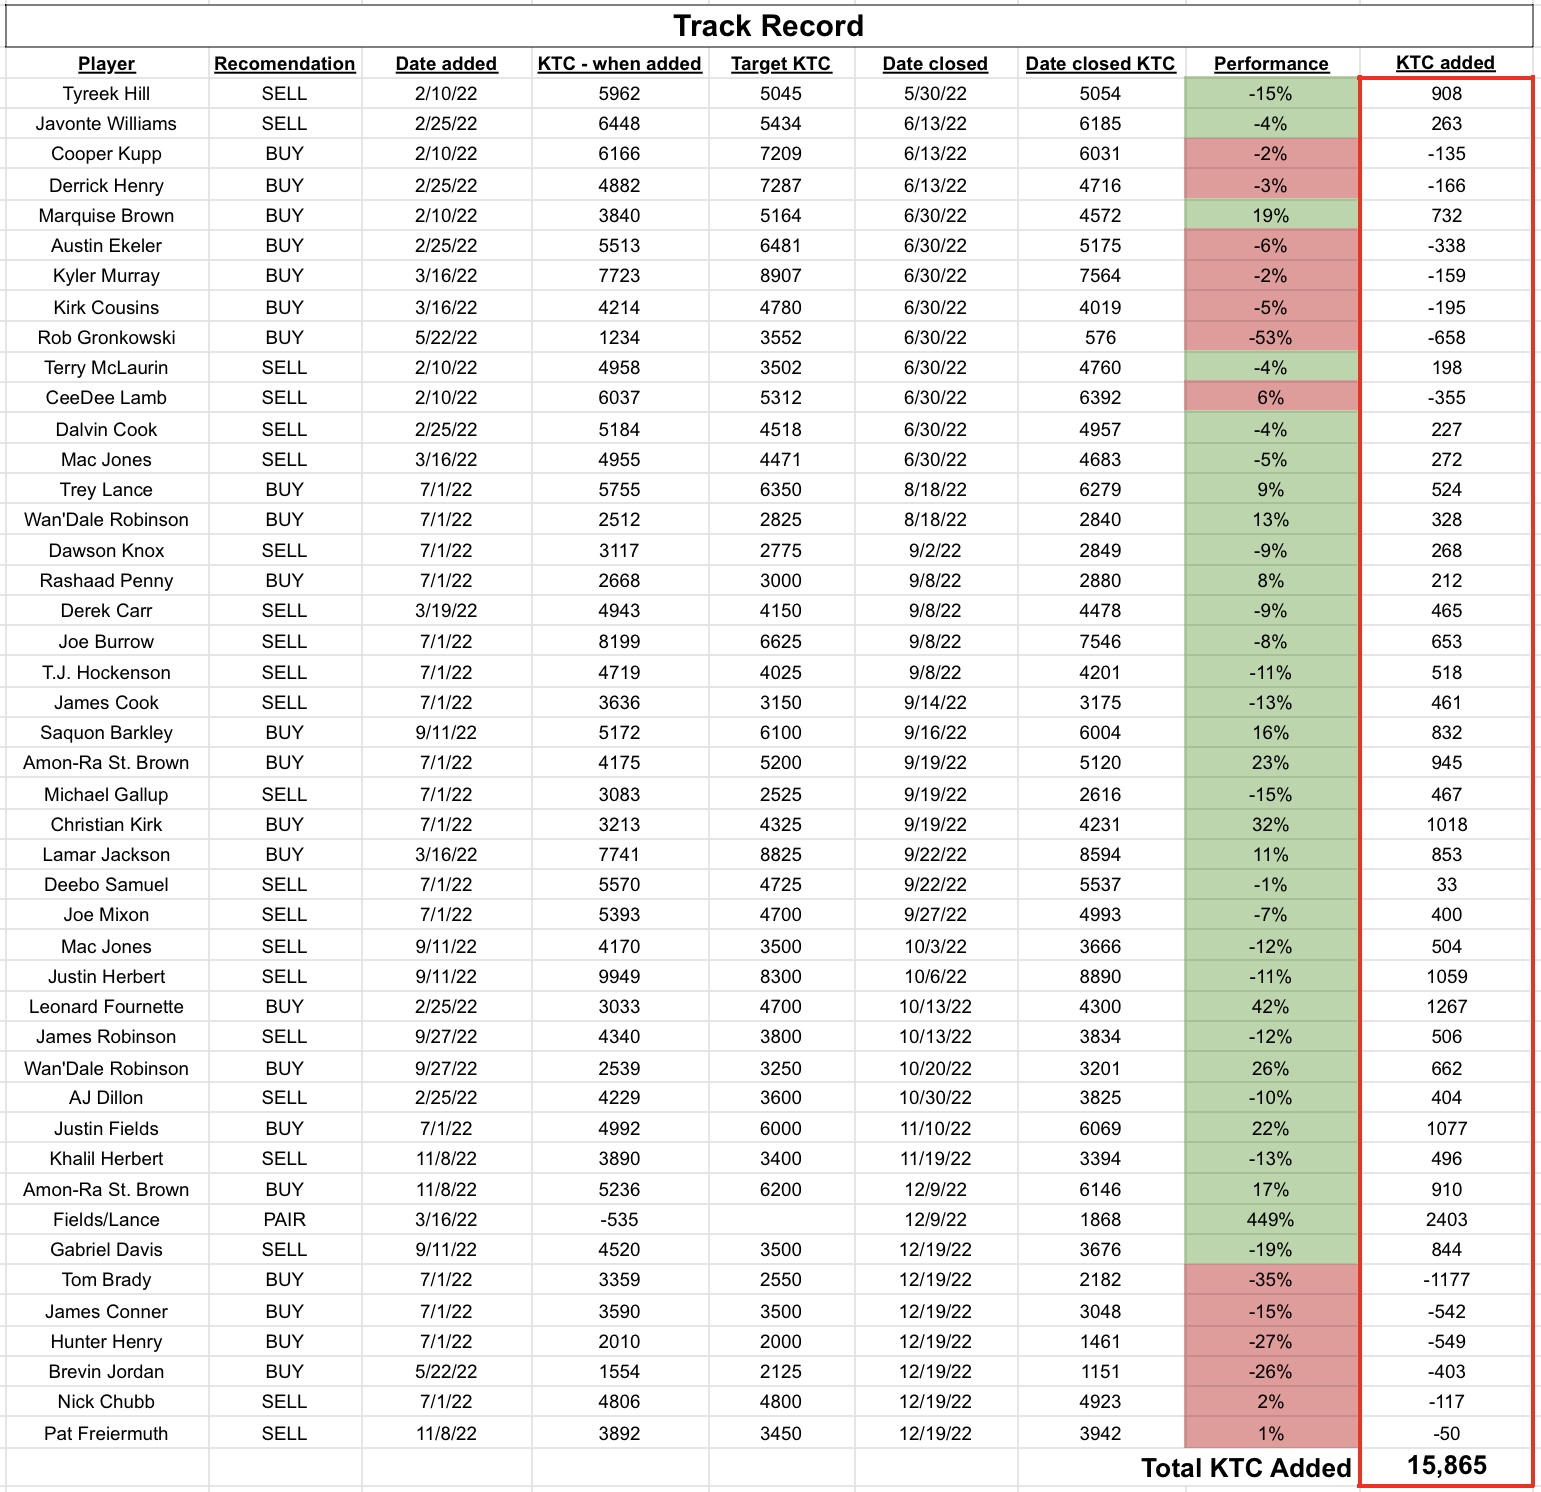
So far, I’ve closed out 45 trades, and 32 of those 45 worked, a ~71% hit rate. Not bad. Looking at the last column, you can see how much KTC was gained or lost by each closed transaction and add it together; it totals ~15,900 KTC of added performance. Not bad at all. If you convert that KTC to draft picks, ~15,900 KTC is the equivalent of two 2023 early-1sts plus a 2023 mid-2nd. Directionally, if you follow the process, you make KTC along the way.
Conclusion
That’s it! Volume 12 was about visualizing valuation and also a lot of changes to the IFFI top pick recommendations. I came to grips with a few bad recommendations and took the losses. Also, we discussed the IFFI track record and gave some example trade ideas. I hope this volume has been helpful, and thanks for reading!
If you are interested in learning more about Dynasty/Devy fantasy football, please follow along on Twitter @_jasonstein and let me know what questions you have and how I can help.
Use promo code “INVESTOR” for 15% off any Dynasty Nerds membership.