 Dynasty Nerds
 Draft Nerds
 NerdHerd
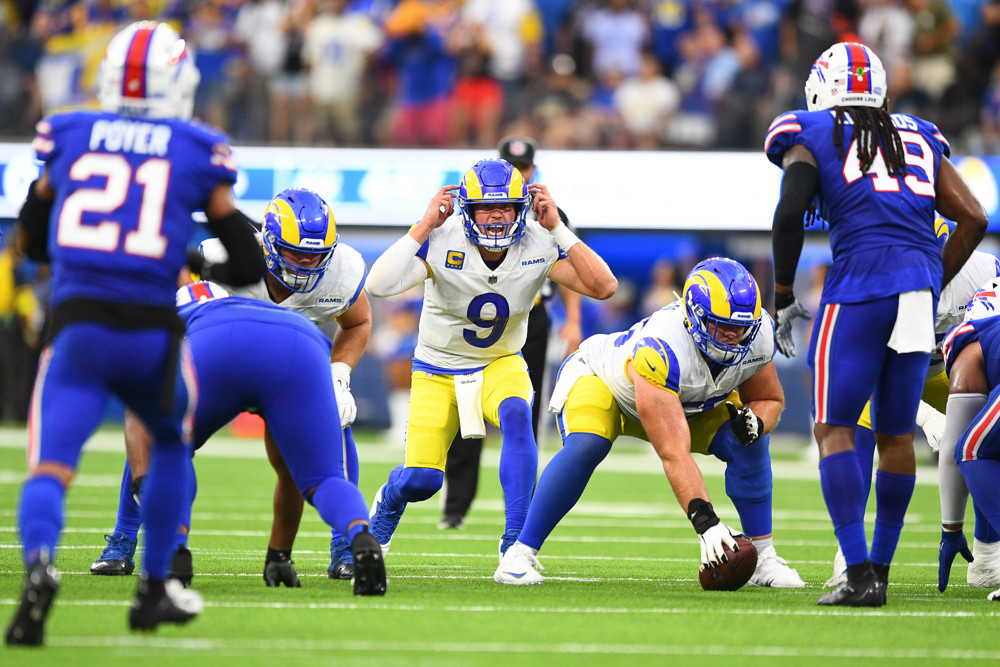

Week 1 of the NFL season is here! If you were here last year for our Full Slate Weekly Advanced Stats content, then you already know about the great information we share throughout your weekly fantasy football season.
As we always do, we skip Week 1 since there isn’t any current-season data to break down just yet. Instead, we thought it would make sense to give you a preview of the advanced stats we are going to use throughout the 2026 season.
We will break down advanced stats for each position, explain why they can impact your fantasy week, and show the ranges for when each stat can be considered good, average, or poor. Once we get into Week 2 and beyond, these numbers will help us identify favorable matchups, potential breakout performances, and players who could struggle in your fantasy lineups.
🔗 Start Building Your Dynasty
Our advanced stats are based on data from the Fantasy Points Data Suite (promo code: NERDS for 25% off).
2026 NFL Fantasy Football Advanced Stats Week 1
Advanced Stats | Team Stats
You’ll notice each matchup starts off with some Team Stats, breaking down important numbers for both the defense and offense as a whole.
Def. Rank vs. Position
There will be rankings for how each defense performs against each positional group in fantasy football. The lower the number, the more elite the defense is against that position. The higher the number, the weaker the defense is against that position.
1–12 = Tough Matchup | 13–21 = Average Matchup | 22–32 = Favorable Matchup
You should be concerned if one of your fantasy players is going up against an elite-level defense against their position. You should feel more confident starting a player if they are facing a poor defense against their position.
Def. Man | Zone | 2 High | 1 High
This advanced stat shows the percentage of the time a team’s defense runs different defensive coverages and schemes. The higher the percentage, the more often that defense uses that specific type of coverage.
Looking at these percentages alone won’t tell you everything, but they become more useful when you compare them to how your fantasy players perform against certain coverages. Once you understand how certain receivers or quarterbacks perform against specific defensive schemes, you’ll have a better idea of whether they have a good or bad matchup that week.
For example, Tua Tagovailoa has struggled against zone coverage in the past and is facing a defense that runs a high percentage of zone, that could be concerning when deciding whether to start him in fantasy.
Advanced Stats | Quarterbacks
QBs vs Man | Zone | 2 High | 1 High
For fantasy football, QB Passer Rating is a useful advanced stat for showing how efficiently a quarterback is playing as a passer. It factors in completion percentage, passing yards, touchdowns, and interceptions to give us a better idea of overall passing performance. This does not include any rushing production.
100+ = Good | 85–99.9 = Average | Below 85 = Poor
We will also break down QB Passer Rating against each defensive scheme. This is where looking back at the team stats can become helpful. For example, if Team A runs a high percentage of man coverage and QB A has a 101 passer rating against man coverage, then generally that quarterback has a solid chance to produce in that matchup. The same can be said for the opposite side of the range.
Deep Throw %
Deep Throw % shows how often a quarterback attempts passes 20 or more yards downfield. For fantasy football, this stat can help identify quarterbacks who are willing to push the ball downfield and create opportunities for big plays and touchdowns.
12%+ = Good | 8–11.9% = Average | Below 8% = Poor
A higher Deep Throw % can show a quarterback could have more fantasy upside because of the potential for bigger plays and more fantasy points. However, a high percentage doesn’t automatically mean strong production because you also have to factor in the quarterback’s accuracy on those throws.
A lower Deep Throw % usually means the quarterback relies more on short and intermediate passes. This could show that the quarterback has a safer floor by getting the ball out short, but may have limited fantasy upside. While there are more factors to consider, Deep Throw % can help identify certain quarterbacks to target in trades depending on your roster build.
ADJ Comp % | Adjusted Completion Percentage
For fantasy football, ADJ Comp % can help show how accurate and efficient a quarterback truly is beyond his normal completion percentage. A quarterback with a high ADJ Comp % is consistently putting the ball in a position for his receivers to make plays, which can lead to more passing yards, sustained drives, and touchdown opportunities.
75%+ = Good | 70–74.9% = Average | Below 70% = Poor
A low ADJ Comp % can be a concern because it suggests the quarterback is struggling with accuracy even after removing some outside factors. When comparing fantasy quarterbacks, this stat can help identify efficient passers who may have better fantasy production ahead of them.
End Zone Attempts
End Zone Attempts (EZ Atts) show how many times a quarterback throws the ball into the end zone. For fantasy football, this is an important stat because it helps measure a quarterback’s opportunities to produce passing touchdowns.
There is no exact number to give a good, average, or poor range, but generally, if a quarterback has a higher number of end zone attempts, you have to like that quarterback’s chances of scoring touchdowns week in and week out.
CPOE | Completion Percentage Over Expected
For fantasy football, CPOE can help show whether a quarterback is more or less accurate than his normal completion percentage suggests. A positive CPOE means the quarterback is completing more passes than expected, while a negative CPOE means he is completing fewer than expected.
3%+ = Good | -2.9% to 2.9% = Average | Below -3% = Poor
CPOE is especially useful when comparing quarterbacks because it gives us more context than simply looking at completion percentage alone.
Advanced Stats | Running Backs
Inside 20%
Inside 20% (I20%) shows the percentage of a running backs’ opportunities that come inside the opponent’s 20-yard line.
For fantasy football, I20% is important because touches and targets near the goal line provide a much better opportunity to score touchdowns and fantasy points. There is no exact number to give a good, average, or poor range, but generally, a higher I20% means the running back is getting more opportunities to create scoring chances.
Exp Run % | Explosive Run Percentage
Explosive Run Percentage (EXP%) shows the percentage of a running back’s carries that result in a run of 10 or more yards.
For fantasy football, EXP% can help show which running backs have the ability to create big plays and gain significant yardage on a single carry. A higher EXP% means the running back is consistently breaking off long runs rather than relying only on volume to produce fantasy points. This can be especially helpful when evaluating running backs who may not receive a high-volume workload.
10%+ = Good | 6–9.9% = Average | Below 6% = Poor
This stat can be especially useful when comparing running backs with similar workloads. It’s a good running back stat to know, although offensive line play, defensive matchups, and rushing volume should also be considered when evaluating it. Note that most running backs will fall in the average range, while those true speedsters can creep over 10%.
MTF/ATT | Miss Tackles Fored Per Attempt
Missed Tackles Forced Per Attempt (MTF/ATT) shows how often a running back forces a defender to miss a tackle on each rushing attempt. It helps measure a running back’s ability to create yards on his own rather than simply benefiting from good blocking.
0.20+ = Good | 0.12–0.19 = Average | Below 0.12 = Poor
This stat can be useful for identifying which of your dynasty running backs have the ability to create more fantasy points by making plays with the ball in their hands. Also, when looking at weekly matchups, knowing how often an NFL defense allows opposing running backs to force missed tackles can give that running back a boost for the week.
YACO & YBCO / ATT | Yards After Contract/Before
Yards After Contact per Attempt (YACO/ATT) shows how many yards a running back gains after a defender makes contact with him on each rushing attempt. For fantasy football, this helps show how well a running back can create additional yards on his own rather than relying completely on his offensive line.
3.0+ = Good | 2.0–2.9 = Average | Below 2.0 = Poor
A high YACO/ATT can be especially valuable for fantasy because these backs may be able to maintain production even in difficult matchups or behind weaker offensive lines.
Yards Before Contact per Attempt (YBCO/ATT) shows how many yards a running back gains before a defender first makes contact. This stat can tell us more about the situation around the running back, including offensive-line play, blocking, scheme, and the amount of running room available.
2.0+ = Good | 1.3–1.9 = Average | Below 1.3 = Poor
A high YBCO/ATT generally means the running back is consistently getting space before being contacted, which can lead to better rushing efficiency and more opportunities for explosive plays. A low number could indicate the back is getting hit near or behind the line of scrimmage.
Advanced Stats | Wide Receivers | Tight Ends
TPRR | Targets Per Route Run
Targets Per Route Run (TPRR) shows how often a player is targeted when he actually runs a route. Instead of simply looking at total targets, TPRR helps show how frequently the quarterback looks toward a receiver or tight end when that player is involved in the passing game.
0.25+ = Good | 0.18–0.249 = Average | Below 0.18 = Poor
For fantasy football, a high TPRR can be a strong indicator that a player is earning targets and is an important part of the passing offense. This can be especially useful for players who haven’t played a full-time role yet. A player may have limited total targets because he isn’t running many routes, but a high TPRR could suggest that if he saw more playing time, there could be more opportunities for fantasy points.
Man | Zone Win Rate
Man | Zone Win Rate shows how often a pass catcher successfully gets open and beats his defender when facing either man or zone coverage.
25%+ = Good | 15–24.9% = Average | Below 15% = Poor
For fantasy football, these stats help us understand what type of coverage a receiver performs best against. A high Man Win Rate can show that a receiver is strong at beating defenders one-on-one. A high Zone Win Rate can show that a receiver is good at finding openings in coverage and getting into spots where his quarterback can find him.
These stats, when compared with the team defensive scheme stats shown in the team section, can help identify players who may have a favorable or unfavorable matchup that week based on how often the opposing defense uses a certain scheme.
SLOT RTE %
Slot Route Percentage (Slot RTE %) shows the percentage of a receiver’s routes that he runs from the slot rather than lined up outside.
Slot RTE % can be especially helpful for weekly start/sit decisions. If a defense struggles against slot receivers or has a weak slot cornerback, a player who runs most of his routes from the slot could have a favorable matchup.
It is important to remember that a high Slot RTE % isn’t automatically good or bad. The key is using it to determine where the receiver lines up and whether that gives him an advantage against that week’s defense.
YAC / REC
Yards After Catch Per Reception (YAC/REC) shows how many yards a player gains after making the catch on an average reception.
6.0+ = Good | 4.0–5.9 = Average | Below 4.0 = Poor
For fantasy football, YAC/REC helps show a receiver’s ability to create additional yards with the ball in his hands. Players with a high YAC/REC can turn short passes into bigger gains, giving them additional fantasy upside without needing to consistently receive deep targets.
For weekly matchups, a strong YAC/REC can be valuable against defenses that struggle with tackling or allow significant yards after the catch.
1 READ %
First Read Percentage (1st Read %) shows how often a receiver is the quarterback’s first option or primary read on a passing play.
30%+ = Elite | 20–29.9% = Good| Below 20% = Average/Poor
This stat helps show how important a player is within his team’s passing offense. A high 1st Read % means the offense is designing plays with that receiver as one of the primary options, giving him more opportunities to earn targets, receptions, yards, and fantasy points.
For weekly start/sit decisions, a strong 1st Read % can give us more confidence in a player’s target opportunity and involvement.
Inline %
Inline Percentage (Inline %) shows the percentage of a tight end’s snaps or routes where he lines up inline, attached to the offensive line, rather than in the slot or out wide.
Inline % can be especially helpful for weekly start/sit decisions. If a defense struggles against tight ends who line up inline, that could give an edge to a player with a high Inline % and create a more favorable matchup for that week.
Advanced Stats | Multiple Positions
XFP | Expected Fantasy Points
Expected Fantasy Points (XFP) estimates how many fantasy points a player should score based on the opportunities he receives, rather than the fantasy points he actually scores.
One of the best ways to use XFP is to compare it with a player’s actual fantasy points. If a player consistently scores fewer fantasy points than his XFP, he could be a candidate for better production if his valuable opportunities continue. A player scoring well above his XFP may be producing at an efficiency level that could be difficult to maintain.
For weekly start/sit decisions, a high XFP can give us confidence that the opportunities are there, even if the player’s recent box-score production hasn’t been impressive.
TGT %
TGT % helps us understand how involved a player is in his team’s passing offense. A high TGT % means the player is earning a significant portion of the available targets, which can lead to more receptions, receiving yards, touchdowns, and fantasy points.
25%+ = Good | 15–24.9% = Average | Below 15% = Poor
Route %
Route Participation Percentage (Route %) shows the percentage of a team’s passing plays where a player runs a receiving route.
Route % helps us understand how involved a player is in the passing offense. The more routes a player runs, the more opportunities he has to earn targets, receptions, yards, touchdowns, and ultimately fantasy points.
A high Route % is especially important for wide receivers and tight ends because it shows they’re consistently on the field and running routes when their team throws the ball. A player can’t earn targets if he isn’t running routes.
It can also be useful for running backs, as it can show which players are seeing involvement, or at least opportunities, in the passing game as well.
YPPR
Yards Per Route Run (YPRR) shows how many receiving yards a player produces for every route he runs.
YPRR helps measure how productive and efficient a receiver is when he’s actually involved in the passing game. Instead of only looking at total receiving yards, it accounts for how many opportunities the player had to run routes.
2.00+ = Good | 1.25–1.99 = Average | Below 1.25 = Poor
A high YPRR can show that a player is consistently earning targets and creating yards when he’s on the field. This can be especially useful for identifying players in smaller roles who could produce more fantasy points if their Route % increases.
A low YPRR can be concerning, especially for a player running a high percentage of his team’s routes. If a receiver is constantly on the field but isn’t producing many yards, it could point toward poor efficiency, a lack of targets, or a limited role in the passing game.
Advanced Stat Matchup Example
If you tune in to the Week 2 content, this is what you’re likely going to see on a week-to-week basis. We may make adjustments as the season goes on, but this will be your guidebook for weekly advice.
You’ll see some players highlighted each week with an advanced stat based on the defense they are playing. Each position group will also have a dropdown where you can see start and sit decisions for players, along with their advanced stats for the week.
Here is an example from stats in 2025….
Week X Fantasy Football Start/Sit
Thursday Night Football | 8:20 PM
San Francisco 49ers (0-0) @ Los Angeles Rams (0-0)
- Los Angeles Rams are favored (-3.5) with an Over/Under of 48.5
Key Advanced Player Stats | Week x Start/Sit
- Key Player Stat
- Key Player Stat
Prior Year Team Stats
| Team | Def. Rank Vs. QBs | Def. Rank Vs. RBs | Def. Rank Vs. WRs | Def. Rank Vs. TEs | Def. Man % | Def. Zone % | 1-HI Sfty % | 2-HI Sfty % |
|---|---|---|---|---|---|---|---|---|
| 49ers | 22 | 14 | 19 | 24 | 15.5 | 79.7 | 50.3 | 49.7 |
| Rams | 11 | 4 | 24 | 14 | 18.8 | 75.9 | 45 | 55 |
Quarterback
| Team | Player | Week 2 Rankings | Confidence Meter | Fantasy Points P/G | Total Yards/G | QB Rate vs Man | QB Rate vs Zone | QB Rate vs 2 High | QB Rate vs 1 High | Deep Throw % | ADJ Comp % | EZ Atts | CPOE | XFP |
|---|---|---|---|---|---|---|---|---|---|---|---|---|---|---|
| Rams | Matthew Stafford | High QB2 | 87% | 26.0 | 276.9 | 133.9 | 103.8 | 111.5 | 107.9 | 13.60 | 74.90 | 52.00 | 3.40 | XX |
| 49ers | Brock Purdy | High QB2 | 85% | 24.2 | 257.1 | 121.6 | 86.6 | 107.5 | 94.5 | 10.60 | 80.50 | 22.00 | 7.10 | XX |
Running Back
| Team | Player | Week 2 Rankings | Confidence Meter | FPPG | ATT % | Off. Snaps % | TGT % | Route % | YPRR | i20% | EXP Run % | MTF/ATT | YACO/ATT | YBCO/ATT |
|---|---|---|---|---|---|---|---|---|---|---|---|---|---|---|
| Rams | Kyren Williams | High RB2 | 89% | 14.4 | 56% | 68% | 7.9 | 47.1 | 1.0 | 58.9 | 4.6 | 0.2 | 2.36 | 2.48 |
| Rams | Blake Corum | High RB4 | 68% | 7.0 | 31% | 29% | 2.3 | 15.4 | 0.4 | 30.0 | 6.9 | 0.2 | 2.35 | 2.90 |
| 49ers | Christian McCaffrey | Mid RB1 | 93% | 21.5 | 65% | 83% | 21.3 | 75.6 | 2.0 | 75.0 | 3.5 | 0.2 | 1.95 | 1.91 |
| 49ers | Kaelon Black | Outside Top 48 | 25% | 0.0 | 0% | 0% | 0.0 | 0.0 | 0.0 | 0.0 | 0.0 | 0.0 | 0.0 | 0 |
Wide Receiver
| Team | Player | Week 2 Rankings | Confidence Meter | FPPG | TGT % | YPRR | TPRR | RTE % | MAN WIN RATE | ZONE WIN RATE | SLOT RTE % | YAC/REC | 1READ % | XFP |
|---|---|---|---|---|---|---|---|---|---|---|---|---|---|---|
| Rams | Puka Nacua | High WR1 | 99% | 19.7 | 28.8 | 3.85 | 0.37 | 75.1 | 24.8 | 13.4 | 35.4 | 5.3 | 37.5 | xx |
| Rams | Davante Adams | Low WR2 | 84% | 13.8 | 23.5 | 2.08 | 0.29 | 76.9 | 36.6 | 15.6 | 14.2 | 1.93 | 26.8 | xx |
| 49ers | Mike Evans | High WR3 | 79% | 8.7 | 21.5 | 1.76 | 0.28 | 65.9 | 35.3 | 17.7 | 24.4 | 1.3 | 27.8 | xx |
| 49ers | Deebo Samuel Sr. | Low WR4 | 64% | 9.5 | 22.4 | 1.73 | 0.23 | 79.2 | 14.9 | 5.2 | 64.8 | 6.6 | 27.3 | xx |
| 49ers | De’Zhaun Stribling | Mid WR5 | 53% | 0.0 | 0.0 | 0.00 | 0.00 | 0.0 | 0.0 | 0.0 | 0.0 | 0 | 0 | xx |
Tight End
| Team | Player | Week 2 Rankings | Confidence Meter | FPPG | TGT % | YPRR | TPRR | RTE % | SLOT RTE % | Inline % | 1READ % |
|---|---|---|---|---|---|---|---|---|---|---|---|
| Rams | Colby Parkinson | Outside Top 24 | 45% | 7.7 | 10.2 | 1.75 | 0.24 | 41.2 | 13.7 | 67.0 | 9.9 |
| Rams | Tyler Higbee | Outside Top 24 | 20% | 5.9 | 10.8 | 1.62 | 0.21 | 49.4 | 25.4 | 59.0 | 11.8 |
| Rams | Terrace Ferguson | Low TE2 | 62% | 3.3 | 5.5 | 1.43 | 0.15 | 34.2 | 48.1 | 28.4 | 7.9 |
| 49ers | George Kittle | Mid TE2 | 70% | 12.1 | 20.0 | 2.30 | 0.25 | 74.4 | 28.6 | 61.9 | 24.3 |
Take Control of Your Dynasty Today
Want to see where your lineup stacks up? Start building like the pros with our most powerful tools and resources:
- 📱 Dynasty Nerds App → Analyze trades, compare rosters—see where you rank.
- 🏈 Dynasty Rankings → Updated player values for every position.
- 🎓 Rookie Mock Draft Hub → Find the next wave of talent for your drafts.
- 🚀 Join the NerdHerd → Unlock premium tools and exclusive extra podcast.
👉 It’s time to take control of your dynasty and see where your lineup truly ranks.