
If you’re anything like me, at some point in your fantasy football career you stumbled into the world of advanced metrics, and you were blown away. It can feel like you’ve found a trove of hidden knowledge, tools to get an edge on your less-savvy league-mates.
But when you listen to some of the sharper analysts talking about these advanced stats it becomes clear that most metrics have as many nay-sayers as advocates. All metrics are not created equal. Some are useful at identifying players on the rise, but others have little direct value at all to a fantasy gamer.
How is the average fantasy player to know the difference? They all look shiny and clean and significant up there on the websites, and analysts certainly talk about them as being useful as they build their case for one player or another.
I’m here to help. I’m no statistician, but some simple analysis can tell us which of these stats correlate to the things we actually care about as fantasy players- fantasy points and increased opportunity- and which do not.
Where to Find Advanced Metrics?
All the stats we’ll be talking about in this article are taken from FantasyData.com– where they’re available on a subscription basis in a sortable table- but they’re also available for free on PlayerProfiler.com. There are tons of other great metrics sites out there- I’m a big fan of Airyards.com and NextGenStats as well, and ProFootballReference.com has really upped their metrics game, now providing many advanced stats, and most of their content is free.
Ok. Let’s go!
Yards per Target and Yards per Route Run
This time out we’re talking about two stats that measure wide receiver efficiency, yards per target and yards per route run. There are many similarities between the two but many differences as well, as you’ll soon see.
Y/TGT
Yards per target is, in some ways, the grandfather of efficiency metrics. It’s old school, it’s useful, but it’s been largely edged out by more contemporary measures.
It describes a fairly clear, occurrence about which information is desirable to us: When a player is thrown the ball, how many yards does he produce? This wraps up the player’s ability to catch the ball and to produce after the catch into one number.
First Look
I like to use color-coding to look at the data set in a common-sense way before I make charts and regressions (color coding is a basic Excell function that matches numerical values to a color gradient). I ask the question: Are the players who are performing well in this measure good players? Which set of players is it picking up?
Here’s a snapshot of the top-30 players in Y/TGT in 2019. The color-coding doesn’t come through in WordPress, but you can still make some observations. If you want to check out a screenshot of the color-coded version, click here.
| ’19 Rank | Name | Y/TGT | PPG |
|---|---|---|---|
| 64 | Mecole Hardman | 13.1 | 7.1 |
| 21 | A.J. Brown | 12.5 | 13.6 |
| 22 | Stefon Diggs | 12.1 | 14.1 |
| 3 | Chris Godwin | 11.2 | 19.7 |
| 39 | Chris Conley | 11.1 | 9.8 |
| 9 | Kenny Golladay | 10.3 | 15.5 |
| 60 | Kenny Stills | 10.2 | 9.2 |
| 47 | Tyrell Williams | 10.2 | 10.2 |
| 10 | Amari Cooper | 10 | 15.4 |
| 87 | Keelan Cole | 10 | 4.9 |
| 42 | Randall Cobb | 10 | 10.3 |
| 32 | Deebo Samuel | 9.9 | 12.6 |
| 23 | Michael Gallup | 9.9 | 15.2 |
| 29 | Terry McLaurin | 9.9 | 13.7 |
| 15 | Mike Evans | 9.8 | 17.9 |
| 31 | Tyreek Hill | 9.8 | 15.7 |
| 13 | Tyler Lockett | 9.6 | 14.7 |
| 11 | DeVante Parker | 9.4 | 15.4 |
| 85 | Tajaé Sharpe | 9.4 | 5.5 |
| 91 | Tre’Quan Smith | 9.4 | 6.5 |
| 52 | Will Fuller V | 9.4 | 12.2 |
| 50 | Breshad Perriman | 9.3 | 9.9 |
| 27 | Calvin Ridley | 9.3 | 15.2 |
| 53 | James Washington | 9.3 | 8.9 |
| 1 | Michael Thomas | 9.3 | 23.4 |
| 67 | Allen Lazard | 9.2 | 8.6 |
| 20 | John Brown | 9.2 | 14.7 |
| 30 | Emmanuel Sanders | 9.1 | 11.2 |
| 88 | Josh Gordon | 9.1 | 6.7 |
| 33 | DK Metcalf | 9 | 11.7 |
It’s clear that Y/TGT does pick up a lot of the best WRs in the league; we know that Diggs, AJ Brown, Godwin, and Golladay are elite players at their position.
It also picks up a subset of WRs that are very efficient but that don’t get a lot of work- guys like Conley or Stills that are largely the WR3 on their team and that often function as deep threats. Good football players, for sure, but not always what we’re looking for in fantasy.
Correlation and Linear Regression
There’s a lot of tools that smart people use to describe data, but the correlation coefficient (Pearson’s R) and linear regression (which gives us an r-squared value) are two of the most common and simplest.
Essentially, the correlation coefficient describes to what degree two variables can be said to be related. Here’s a link if you’d like to learn more.
If we have a correlation coefficient close to 1, it means the data is very closely and positively correlated; close to -1 means a close, negative correlation, close to 0 means that data isn’t very well correlated.
R-squared is a measure of how well a variation in one variable explains a variation in the other; we can also say that it describes how well the line of our linear regression fits the data. Here’s a link if you’d like to learn more.
An r-squared close to 1 in our regression would mean that the two variables had a nearly perfect linear relationship. An r-squared closer to 0 suggests the variables aren’t strongly related.
Let’s apply these tools to our Y/TGT data set (the data set is about 100 points, if you’re wondering).
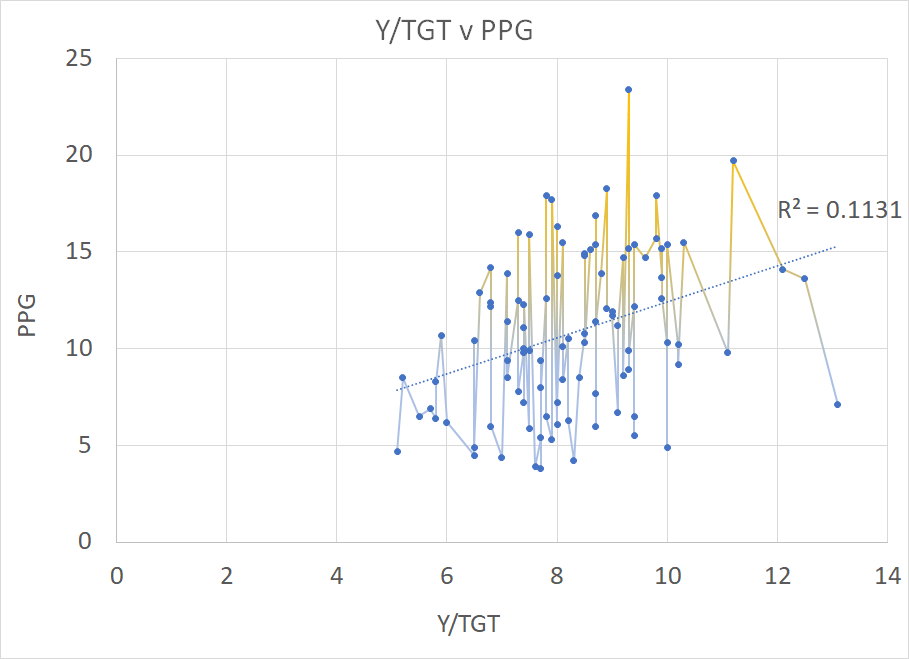
When we throw the data into a scatter plot, this is what we get. You can see that there is some positive correlation between the T/TGT and PPG; as Y/TGT rises, PPG tends to rise as well. But how strong is the correlation?
The r-squared value is .1131; that’s not indicative of a strong or predictive relationship. Similarly, the correlation coefficient for this set was 0.336356, which is a weak-to-moderate correlation.
The Verdict
Is Y/TGT a useful metric for predicting fantasy success? Not really, at least not in a direct manner. It tells us the player is efficient with his opportunities, but that’s far from the whole picture for fantasy football.
A high Y/TGT is a great asset for a player to have in his profile, but it doesn’t tell us enough about the talent of a player or about the player’s success to warrant too much attention from fantasy managers. Opportunity is king in FF and this stat doesn’t consider opportunity.
The players on this list are all solid at football, they’re just not necessarily the best WRs or even the 2nd best WR on their own team. It’s certainly worth taking shots on guys like Conley, Stills, or Williams in the late rounds of your startup (you can do worse as a WR7 or 8). I like some of these guys in best ball as well; efficient, high-aDOT guys can win you a week or two.
I do think it’s appropriate to take a closer look at the profile of the young players that pop in this metric to see if there are other strong aspects to their profile- three in particular that made this list for me were Mecole Hardman, Tre’Quan Smith and Allen Lazard. These are all guys that have performed well with the work given and who might receive more opportunity moving forward.
Y/RR
Yards per route run is Y/TGT’s younger, sleeker, smarter cousin. It goes a step further; by adding in the element of routes run as opposed to merely targets, we’re getting a metric that describes how often the player is getting open / earning opportunities and targets. It puts a number to the player’s production relative to the number of plays on which he was a receiving option.
Y/RR is Y/TGT with TGTs/RR, which is in itself a useful metric (though not part of our analysis here).
First Look
Here’s the top of the Y/RR data set (the full set is 100 data points, I cut this sample out for clarity, just as I did for the Y/TGT data earlier).
| ’19 Rank | Name | Y/RR | PPG |
|---|---|---|---|
| 21 | A.J. Brown | 3.46 | 13.6 |
| 1 | Michael Thomas | 3.17 | 23.4 |
| 22 | Stefon Diggs | 2.97 | 14.1 |
| 24 | Davante Adams | 2.87 | 17.7 |
| 2 | Julio Jones | 2.82 | 18.3 |
| 31 | Tyreek Hill | 2.7 | 15.7 |
| 15 | Mike Evans | 2.67 | 17.9 |
| 3 | Chris Godwin | 2.61 | 19.7 |
| 10 | Amari Cooper | 2.6 | 15.4 |
| 12 | Jarvis Landry | 2.52 | 14.8 |
| 19 | Courtland Sutton | 2.48 | 13.9 |
| 20 | John Brown | 2.46 | 14.7 |
| 5 | DeAndre Hopkins | 2.45 | 17.9 |
| 23 | Michael Gallup | 2.44 | 15.2 |
| 52 | Will Fuller V | 2.43 | 12.2 |
| 16 | D.J. Moore | 2.4 | 15.4 |
| 54 | Hunter Renfrow | 2.39 | 10.3 |
| 29 | Terry McLaurin | 2.38 | 13.7 |
| 13 | Tyler Lockett | 2.37 | 14.7 |
| 32 | Deebo Samuel | 2.37 | 12.6 |
| 9 | Kenny Golladay | 2.35 | 15.5 |
| 75 | John Ross III | 2.28 | 11.9 |
| 6 | Keenan Allen | 2.25 | 16.3 |
| 46 | Marquise Brown | 2.25 | 10.5 |
| 4 | Cooper Kupp | 2.24 | 16.9 |
| 57 | T.Y. Hilton | 2.24 | 12.5 |
| 11 | DeVante Parker | 2.23 | 15.4 |
| 25 | Odell Beckham Jr. | 2.2 | 12.6 |
| 7 | Allen Robinson II | 2.19 | 15.9 |
| 67 | Allen Lazard | 2.19 | 8.6 |
It doesn’t take a genius to see that this metric is generally picking up the most talented guys in the league. Out of that 30-player sample, only 7 finished outside the top-31 in PPR points on the season, and that was three rookies and four guys with injuries. Tyreek was WR31 despite missing 4 games to injury.
The color-coded image of this data is definitely work checking out here. The two numbers clearly travel together.
Correlation and Linear Regression
Here’s what our scatter plot looks like for the Y/RR data:
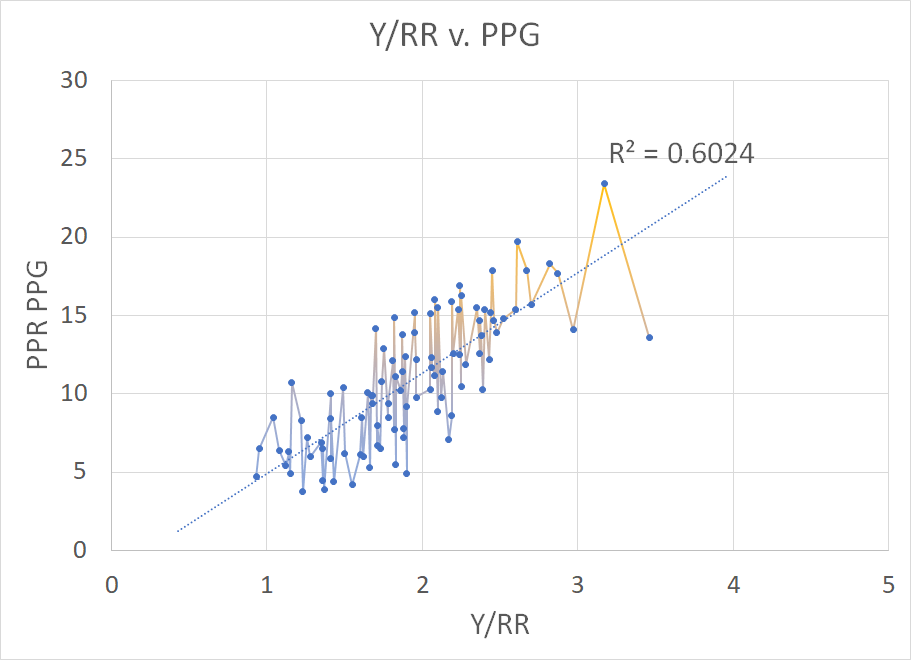
That’s a nice line! We like seeing the data points clustered tightly like that and rising together. It’s clear there’s a fairly linear relationship at work, and our analysis backs that up. An R-squared of .6024 indicates a substantial relationship between the two stats; the correlation coefficient for this data set is .776126, which indicates a strong, positive correlation.
The Verdict
Is this a useful metric? Yes, yes it is.
It seems that players producing high Y/RR numbers are likely to also produce high amounts of PPR points. Most of these guys are already known, locked-in studs, but it’s worth taking note of some of the other players on the chart.
The Obvious Risers
This group is the 1st / 2nd year WRs that enjoyed a 2019 breakout: AJ Brown, DJ Moore, Michael Gallup, Courtland Sutton, Terry McLaurin, Deebo Samuel, Marquise Brown. You should feel good about drafting these guys where they’re going; Gallup, Holywood and Deebo (post-injury) are values at ADP.
The Old and Unappreciated
These guys will outperform ADP: Jarvis Landry, Devante Parker, John Brown, TY Hilton. Injuries have been an issue for Parker and Hilton, but both are full-go as we approach the season. These are all guys you should want on your teams, and they all come at a value.
The Sneaky Buy Candidates
This group isn’t likely to be league winners, but they might well be excellent depth options / fill-ins: Alan Lazard, John Ross Jr., Hunter Renfrow.
It looks like Lazard has the Packers WR2 role heading into 2020 season, and this metric backs up the front office decision to not bring in WRs though the draft. They might already have the solution on the roster.
Joss Ross Jr. is essentially Will Fuller (who also could have made this list). Both are great when they’re healthy. The other difference, of course, is that Fuller has played most of his career with an elite QB in Deshaun Watson while Ross has been paired with a struggling Andy Dalton. I love him as a late-round flier. They brought in Higgins as a X / Green replacement, not as a Z / downfield speed threat. There should still be a role for a healthy Ross in the now-Burrow-led Bengals offense.
Hunter Renfrow’s situation is seemingly a bit more complicated, as his team just brought in a veteran TE, two highly-drafted rookie WRs, and a slot / RB hybrid. Also, you’ll hear his detractors frequently say that his stats were padded by two big breakaway plays.
I say, great! He had two big, breakaway plays on limited work, and now his offense should be improving. He’s never going to get the volume of a WR1 or WR2, but where he’s going- WR71- he’s well worth the negligible risk.
Using Efficiency To Predict Future Opportunity
We’re going to wrap this one up by applying this methodology to another question: are these metrics of any value in predicting future success or increased opportunity?
Y/TGT
They say a picture is worth 1000 words, so here’s 3 charts that tested this for Y/TGT. I plotted 2018 Y/TGT against 2019 PPG, 2019 TGTs, and then a 3rd number, ^TGTs, which is a measure of how many TGTs a player gained or lost from ’18 to ’19, controlled for how many more or fewer games they played.
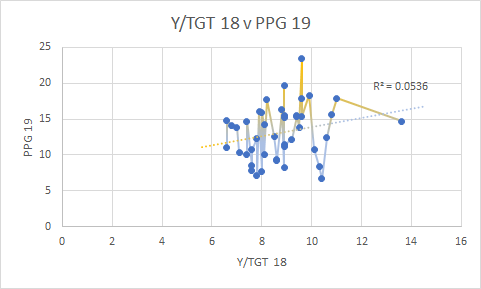
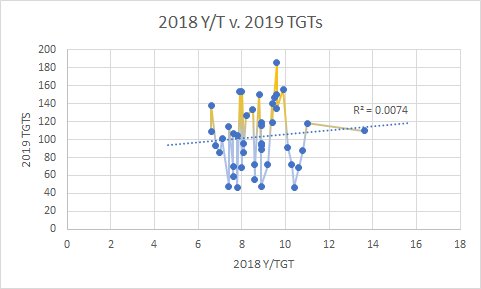
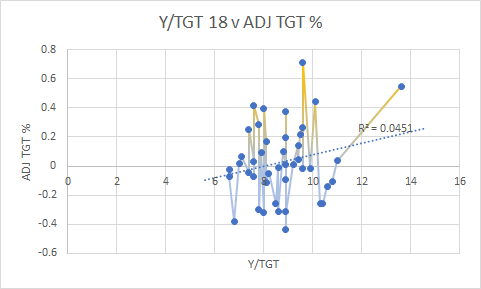
As you can see, Y/TGT didn’t hold up well in any of these three cases. The .0536 r-squared from Y/TGT v. PPG was the best of the bunch and that’s number is not a good indicator of any significant relationship between the two variables.
So can Y/TGT predict future success or increased opportunity? Probably not.
Y/RR
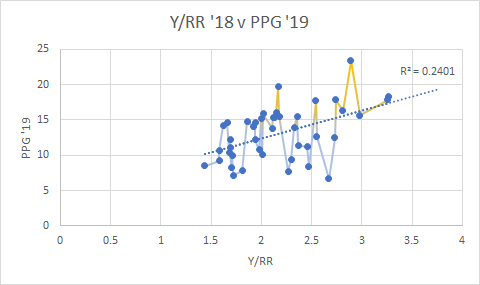
We’re going to use our charts to look at the same questions in regards to Y/RR.

First, let me point out that the data set for these regressions is smaller, and thus inherently noisier (the intersection of the top-100 of these stats from ’18 and ’19 turns out to be only 43 players, which in itself is an interesting datum).
Let’s check our graphs. Our regression of Y/RR (18) v. TGTs (19) yielded an R-squared of .1547 (CORR of .3933). This indicates there is an evident relationship between the two variables, though it’s not enough to call a strong relationship.
Similarly, our data for Y/RR (18) v PPG (19) yielded an R-squared of .2401 (CORR of .4899). Again, this is indicative of an evident, linear relationship., though nowhere near a perfect correlation.
Although these don’t meet scientific thresholds of “strong” correlations, those numbers vary widely from field-to-field; in fields dealing with the complexities of human behavior, much lower thresholds may be deemed significant (as opposed to measuring physical phenomena).
Given the infinite variables acting in a sport like football, I’m pretty happy with these numbers. It’s over my head to make any authoritative statement of significance about these numbers, but the demonstration of a linear, year-to-year relationship is enough to get me at least a little enthusiastic at these results.
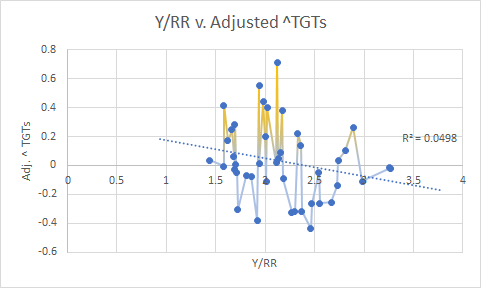
It’s interesting to me that the regression of Y/RR v. Adjusted ^TGTS showed the weakest relationship. Intuitively, it seems like an efficient receiver would earn more targets the following season; while we can’t say that’s not true, it does seem that there’s at least too many confounding factors for that relationship to show up in the data.
I would guess if we narrowed our parameters to rookie / 2nd year WRs and expanded our dataset we’d be likely to find more of a relationship, but that’s outside of our scope in this exercise.
If you are wondering, the Adjusted ^ TGTS number is
(% of 2018 TGTS that were received in 2019) – (% of 2018 GMS played in 2019)
So the number itself has no inherent meaning, but it gives us a higher number if the player received more targets in fewer games and a lower number if the player received fewer targets in more games.
I’m including a screenshot of my dataset here, in case anyone is interested.
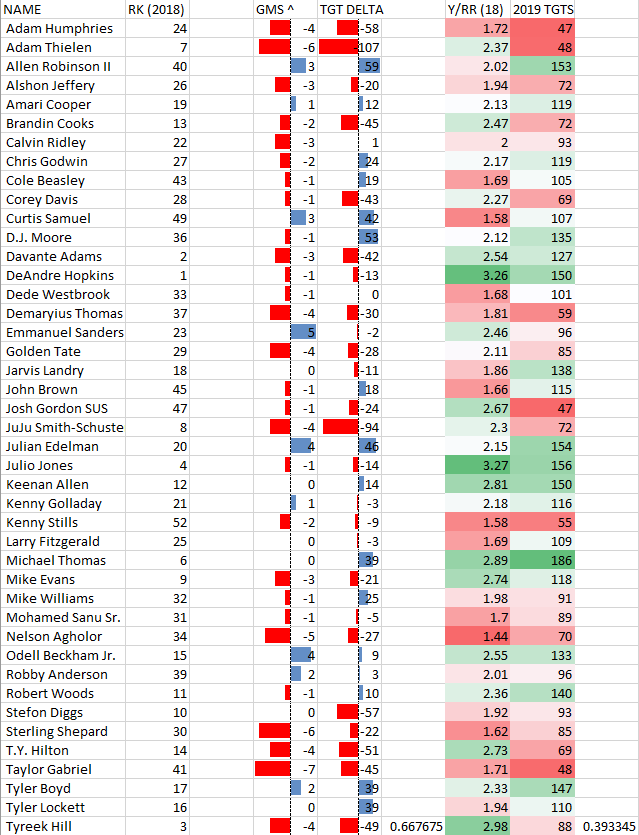
Perhaps unsurprisingly, the strongest relationship I found with ^ TGTs was ^ GMS; playing fewer games led to getting fewer targets.
That’s it for this time out! Throughout the rest of 2020, we’ll be looking at other efficiency metrics to see which are worth watching.
As always, you can get me on Twitter at @ekballer with any questions or feedback. Hopefully, you got a few actionable ideas here- go poke around at Lazard and Renfrow!
Thanks for reading!