
The ability to determine metrics or statistics that determine an RB1 in fantasy football is an essential tool. Playing fantasy football in 2021 is a joy if analytics or mathematics is your thing. We have access to hundreds of databases of information and statistics that just weren’t possible ten or fifteen years ago. One debate we can settle using math is Quantity (volume) versus Quality (efficiency) regarding the running back position. This article will explore whether it is more important to emphasize backs that receive a high volume of work or those that are more efficient with the touches they are given.
The Study
For a bit of setup for this study, we will assume a half PPR league with other scoring settings set as standard. There are many ways to score the running back position nowadays; point per carry, point per first down, etc. It is best to keep the scoring simple as to limit any noise in the data. We will be studying the past six years of NFL data, beginning with the 2015 season and concluding with the 2020 season. We will not be including the current season in this study. This study is limited to the top 12 running backs for each season based on total points scored throughout that particular year. Finally, I would like to thank PFF.com for collecting all of this data. Without their database, this study would have taken much longer.
Quantity: A Study In Volume
The quantity aspect of this debate is a very straightforward one. How much work is each running back getting? For our study, we will designate volume as total touches. This will include both rushing attempts as well as receptions. We include receptions because, in any PPR league, a reception will give you points. As long as a running back is touching a ball, it is getting counted as volume. The scatterplot below visualizes all of the volume data for any RB1 over the past six NFL seasons.
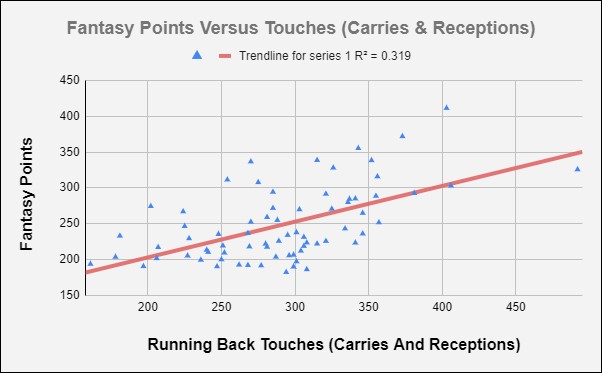
Now, as can be expected, as volume increases for a running back, the fantasy output for that running back also increases. Logically this makes sense. A running back, or any player for that matter, cannot score fantasy points unless they are touching the ball. The R-squared value for this trendline is only 0.3. If that sentence doesn’t make any sense, don’t worry; I will review what this exactly means. A trendline in a scatterplot is the line that attempts to go as close as possible to as many data points as possible. This is used as a predictive tool, where you could potentially predict one input based on the other. We would use this tool to try to predict fantasy output based on a given volume. This is the basis for any fantasy projections you may see on your favorite fantasy site. To be predictive, we would ideally want an R-squared of at least 0.5 or greater. This can also be referred to as correlation. But as you will see as we continue, the volume may be the most predictive stat we have to use.
Quality: A Study In Efficiency
Quality of touches is a much harder statistic to study. There are many different ways to define efficiency, a debate that could take an entire article in itself. For this study, we are going to use two separate statistics to attempt to determine efficiency. The first number we are going to look at is Yards Per Route Run. Yards Per Route Run (YPRR) is much more predictive at receiving game success than simply yards per target or yards per reception could ever be.
For one thing, targets are earned and not given. We cannot discount the ability for a player to get open to earn a target from their quarterback. Not every player has this ability, and we should be noting when targets are attained. The reason for looking at targets is that we are referring to leagues that are half PPR. They reward half a point for every reception a player can haul in. We have to remember that players are not running a route on every offensive snap. They could be pass blocking, run blocking, or rushing the ball themselves. This makes the YPRR statistic a much cleaner approach to determining how involved a player is in their team’s passing attack.
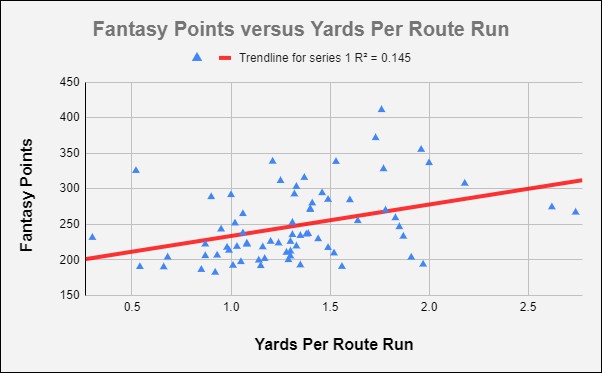
The scatterplot above outlines the correlation between YPRR and Total Fantasy Points Scored over the past six seasons for every running back that has scored as an RB1. As you can see by observing the R-squared value, there is very little correlation between the two data sets. 0.145 is even less than the value of 0.3 when we looked at total touches versus fantasy points. There is one thing we can learn from this study, though. 96% of the RB1 finishes from 2015 to 2021 saw a YPRR between 0.5 and 2. We can use this piece of data when observing young running backs as they enter the league. Ideally, we should be on the lookout for rookies that have a YPRR of at least 0.5. Some examples of this from the 2021 class would be Najee Harris (1.28), Javonte Williams (1.18), and Michael Carter (1.87).
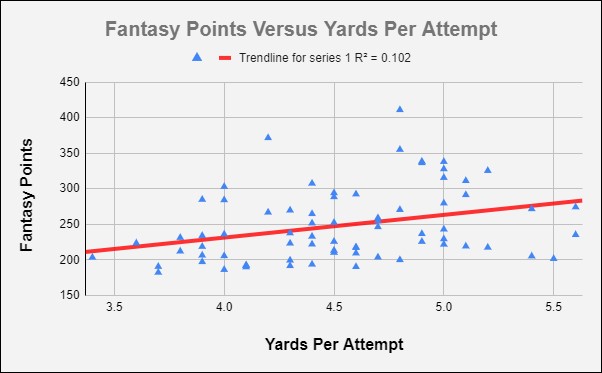
The second statistic we will look at for efficiency is Yards Per Attempt. This statistic quantifies how many yards a running back can gain per rushing attempt. As you can see in the scatterplot above, this statistic shows the least correlation out of the three we have observed in this study. An R-squared value of 0.102 is not an excellent sign for trying to identify trends. It is important to note that only one running back in the past six years could sustain an RB1 season while averaging less than 3.5 YPA. That running back was Danny Woodhead in 2015, who did so with less than 100 rushing attempts and over 80 receptions on the season. You can never undersell the importance of running backs who can catch passes.
The Conclusion
Quantity versus Quality, when it comes to dynasty fantasy football and running backs, volume is king. While it may be nice to know where running backs fall in terms of efficiency in both the passing game and running game, it is the pure touches that we want to target. However, this is a fine line to ride. More touches will inevitably lead to more wear and tear, leading to more injuries down the road. We are seeing this come to fruition with backs such as Derrick Henry and Christian McCaffery suffering severe injuries after being the volume kings the past two seasons. As with everything in dynasty, it is all about finding the right time to buy and the right time to sell.
I hope you enjoyed this dive into scatterplots, Yards Per Route Run, and how math can help us in fantasy football. For more content like this, be sure to give me a follow on Twitter @DanT_NFL. DMs are always open for any questions, comments, or craft beer recommendations!
Make sure to subscribe to the #NerdHerd, where you get exclusive content, dynasty/rookie rankings, and DynastyGM! Additionally, if you want 15% off of ANY SUBSCRIPTION, USE PROMO CODE ‘LUNA’ or CLICK HERE.