
Production has long been a guide in deciding who will or won’t be successful in the NFL. As far as dynasty goes, we should only care about what a running back did in college in how it relates to fantasy success. So apart from raw stats, what should we be looking for? Among a plethora of resources in your arsenal, there are few signals stronger than competition adjusted production.
Adjusting RB Production for Competition
The premise is simple: 100 rushing as an RB for Alabama against LSU is more impressive than 100 rushing yards as an RB for North Dakota State against Iowa. While that may seem obvious, there’s a very measurable way we can translate this into fantasy relevance; that is, by using the level of internal and external competition. It turns out that SportsReference.com has created a way to measure both of these aspects with their metrics of SRS and SOS
Competition is two-fold:
- Internal Competition – SRS (Simple Rating System)
- Beating out others for playing time on a high recruiting, quality team.
- External Competition – SOS (Strength of Schedule)
- Degree of difficulty against defensemen and teams.
SRS shows us the value, strength, and pedigree of a team during a season. For example, LSU, Alabama, and Ohio State have been frequently near the top of their rankings year after year. SOS varies more from season to season as it strictly depends on the exact teams they faced during the season. We can now use these metrics of SRS and SOS to adjust production to see what it means for fantasy.
How Competition Adjusted Production Translates to Fantasy Success
As mentioned earlier, production by itself is already indicative of scoring fantasy points early in a running backs career. This is measurable by correlating their final season stats in college to their 3-year PPG window in the NFL.
In the charts below, you can find RB’s RushY/G, RecYards/G, TotalY/G, and FP/G. You will also find their team’s SRS and SOS for that final season, showing the level of competition they were succeeding at. Finally, the gray column next to each stat shows that respective stat adjusted for competition (SRS and SOS) as it projects to fantasy points. The top row shows how much each stat has then correlated to their 3-year NFL PPG after they were drafted.
The sample size I will be using will consist of every RB drafted in round 1-4 since 2015.
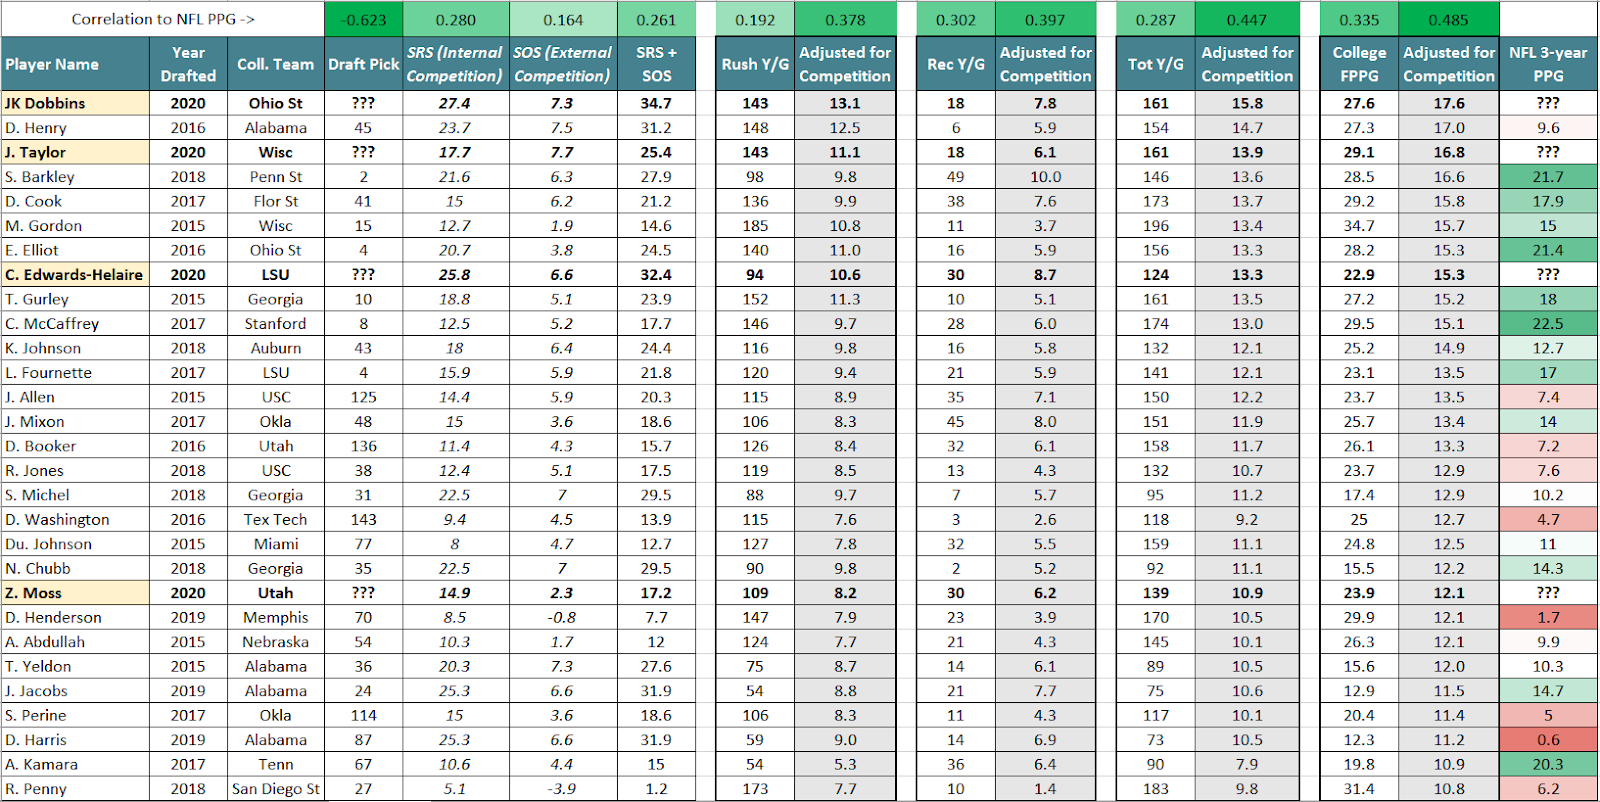
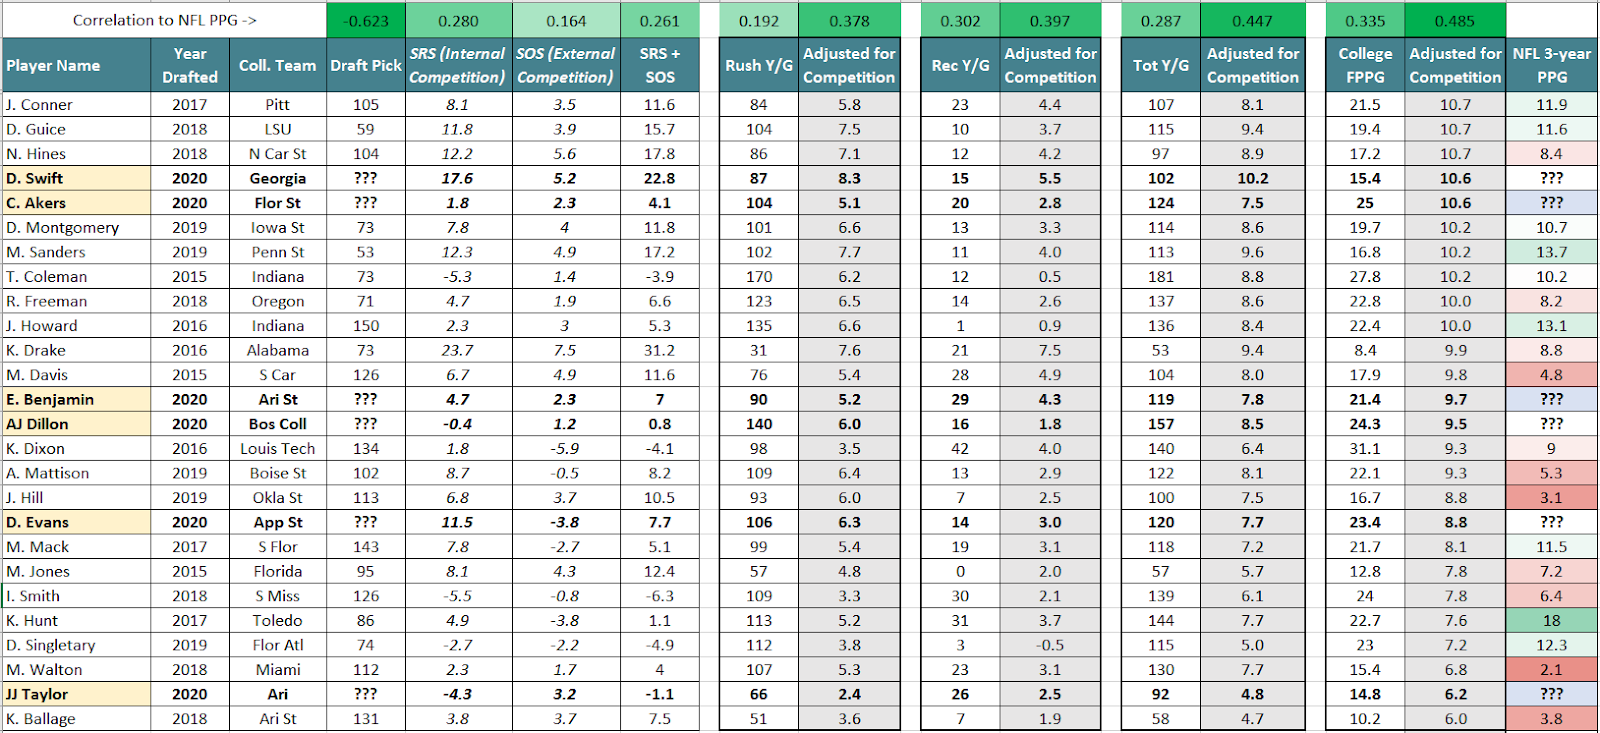
The most important takeaway from the chart above are the gray columns, Stats Adjusted for Competition. Look at how much these stats improved for predicting fantasy success when you do so:
Correlation to NFL 3-year PPG (Stat Correlation VS Stat Adj for Competition Correlation)
- RushY/G
- 0.192 to 0.378
- RecY/G
- 0.302 to 0.397
- TotalY/G
- 0.287 to 0.447
- FPPG
- 0.335 to 0.485
As you can see, the signal for future fantasy points increases dramatically. Again, there are many factors to consider when evaluating prospects, but this should certainly be a tool that you include.Let’s take a look at some of the top 2020 RB prospects and see how they ranked!
JK Dobbins
Ohio State recorded the highest combined SRS and SOS in the last five years out of any school. Dobbins already had massive production in 161 total yards/game and 27.6 FPPG. When you factored in the level of competition he did this at, he showcases the best single-season adjusted production profile seen in recent history.
Jonathon Taylor
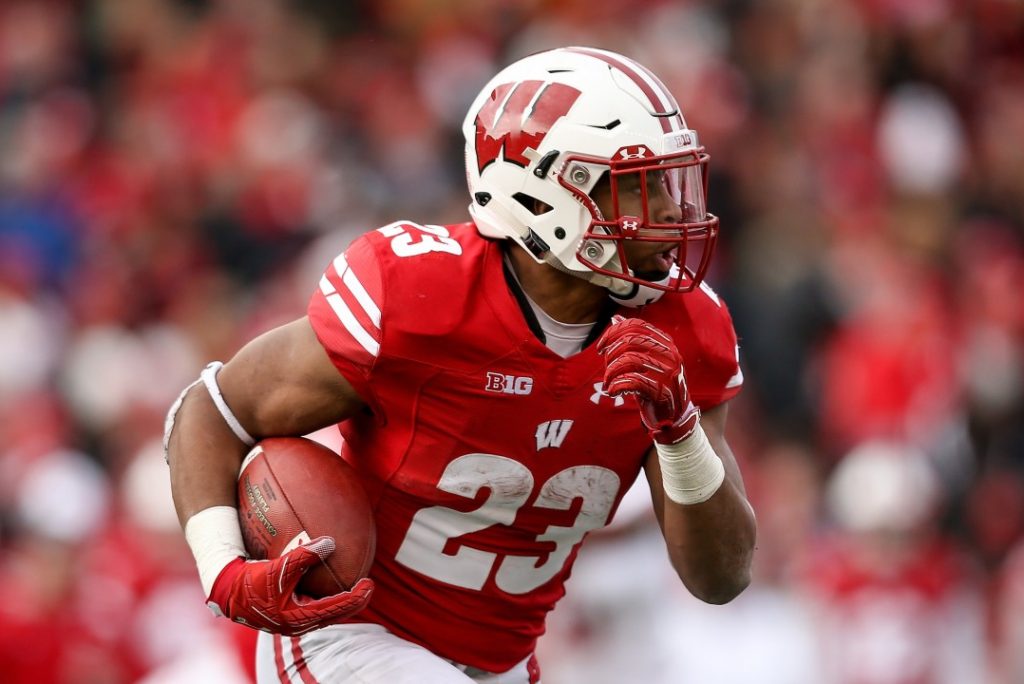
Another top team mark in the last five years, Wisconsin had the most difficult Strength of Schedule (SOS) out of any team in this database at 7.7. If you factor SOS being worth more in predicting fantasy value, then it becomes easy to see why many have Taylor as a generational prospect. Combined with his overall collegiate career, his profile is one of the more impressive ones we have ever seen.
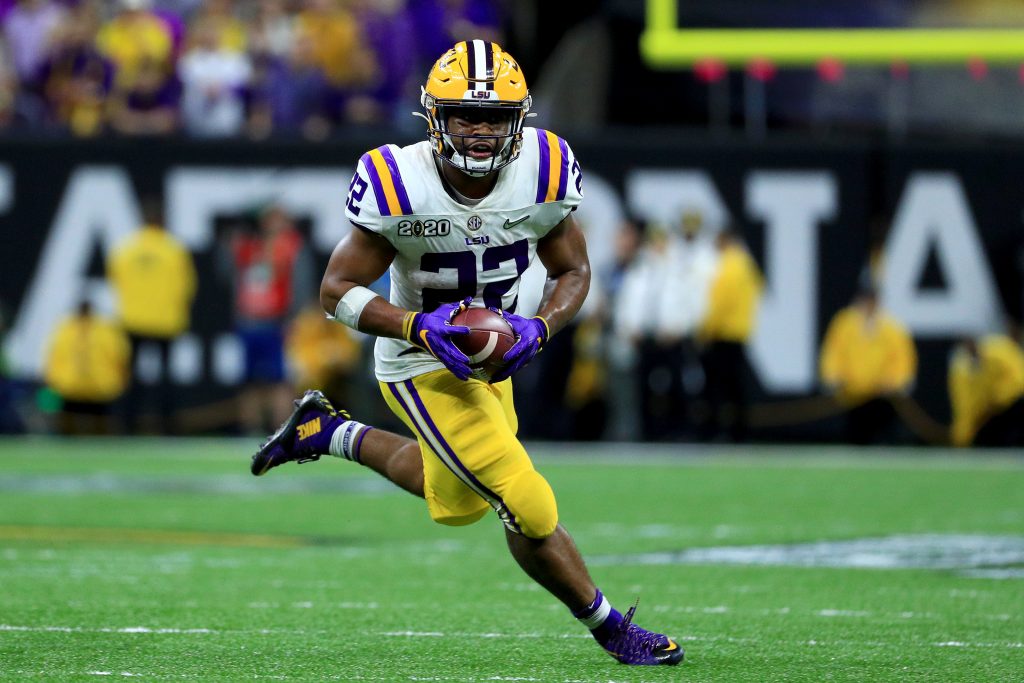
Clyde Edwards-Helaire
Following a poor combine performance, many have written off CEH as the RB5 or worse. While he doesn’t have the career-long dominance as some of the other names, his final season was amazing. His projected PPG are in the same ballpark as many first-round picks of years past, and his receiving profile is attractive in PPR leagues. Don’t sleep on him.
D’Andre Swift
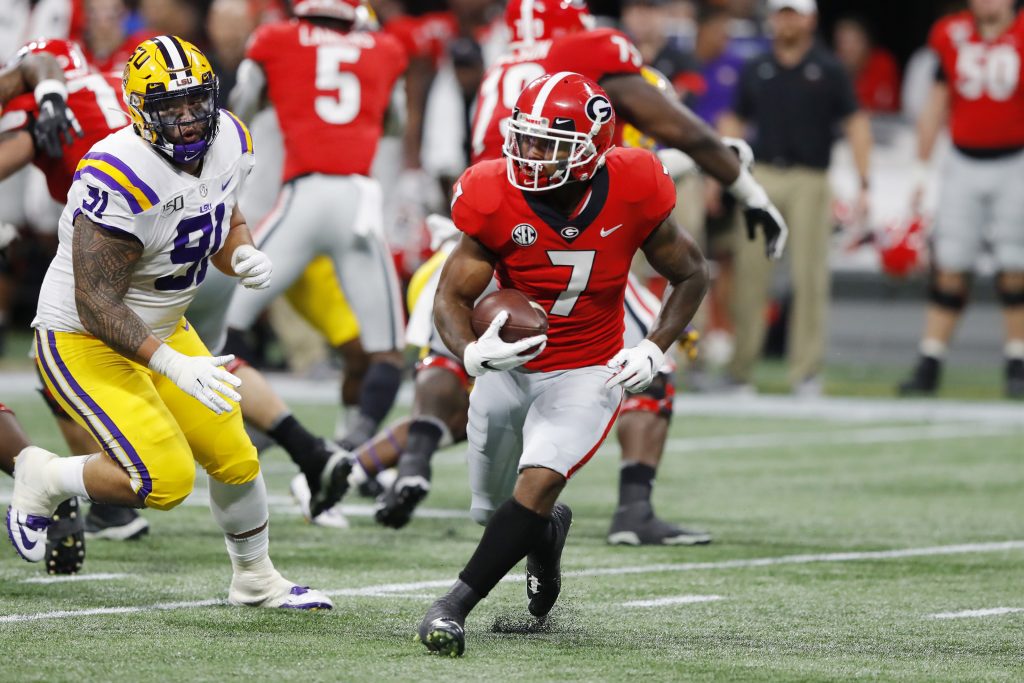
Swift is not a production darling; he’s an intangible and film darling. Commonly listed as the RB1 for 2020, he didn’t take the production leap many hoped. Swift is still an amazing player and may take the Josh Jacobs route to success if he goes to a team that knows how to use him properly.
While this gives you a very useful snapshot of college production means for your dynasty rosters, be sure to come with a holistic view that includes draft capital, film review (DynastyNerds recently launched NerdScore for this), and landing spot among your evaluations.
Thanks for reading and stay golden! If you like what you learned, follow me @DavidZach16 for more interesting stats and tidbits throughout the year.